Observing Geometry, Data Granules, and Sample Radiance Observations
Day and Night: Ascending and Descending Node Observations
The northward moving part of the sun-synchronous Aqua orbit is commonly referred to as ‘ascending node’. This is the sunward-facing part of Earth, so most ascending node data are in daytime. Exceptions occur near the poles away from the equinoxes, when parts of the ascending node are in the Earth’s shadow. Similarly, most descending node observations are taken at night.
All AIRS granules are labeled as either ascending, descending, or transitional (a combination of ascending and descending at the highest latitudes). Because of this nearly complete day-night distinction, Level 3 data are reported as ascending node, descending node, or both nodes combined.
Instrument Timing and the Six Minute Time Granules
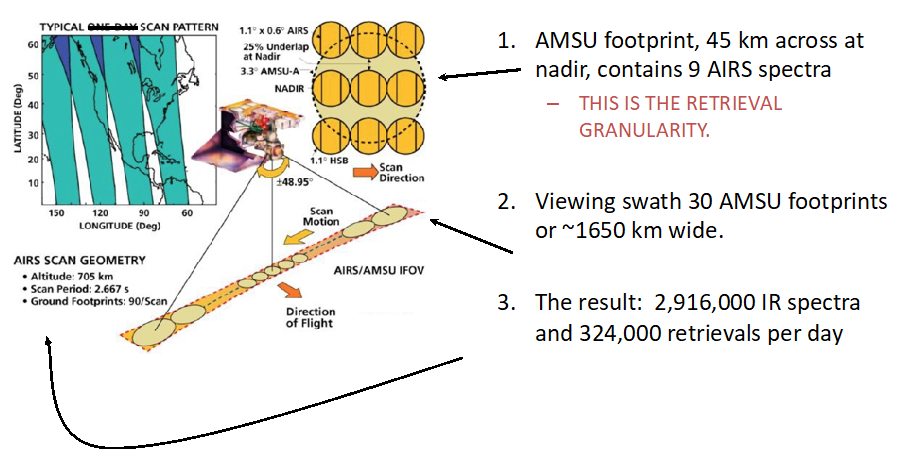
AIRS data obtained along the viewing swath are archived in ‘granules’ representing six minutes of wall-clock time. Six minutes was chosen because it is the smallest integer number of minutes where AIRS, AMSU, and HSB all take an integer number of scans. In six minutes AMSU takes 45 scan sets of 30 across-swath footprints, while AIRS and HSB scan at three times this rate for 135 across-track scans, each containing 45 of their fields of view. This definition of granule time is convenient because it divides evenly into ten granules per hour and 240 granules per day. However, orbits contain non-integer numbers of granules.
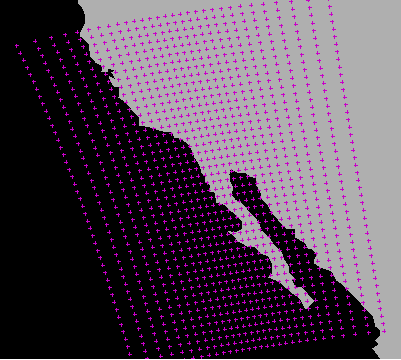
Figure 5 illustrates the locations of all AMSU footprints over western Mexico and the United States that make up Granule 209 on September 6, 2002. Since the granule is from an ascending, or daytime, part of the orbit, the spacecraft track tends toward the northwest. Nighttime orbits are aligned in a south-southwesterly direction. As Figure 2 shows, the scan direction on Earth as seen from the Aqua spacecraft and facing the direction of motion is left to right.

Figure 5: AIRS/AMSU/HSB Footprint Pattern Sept 6, 2002; Granule 209.
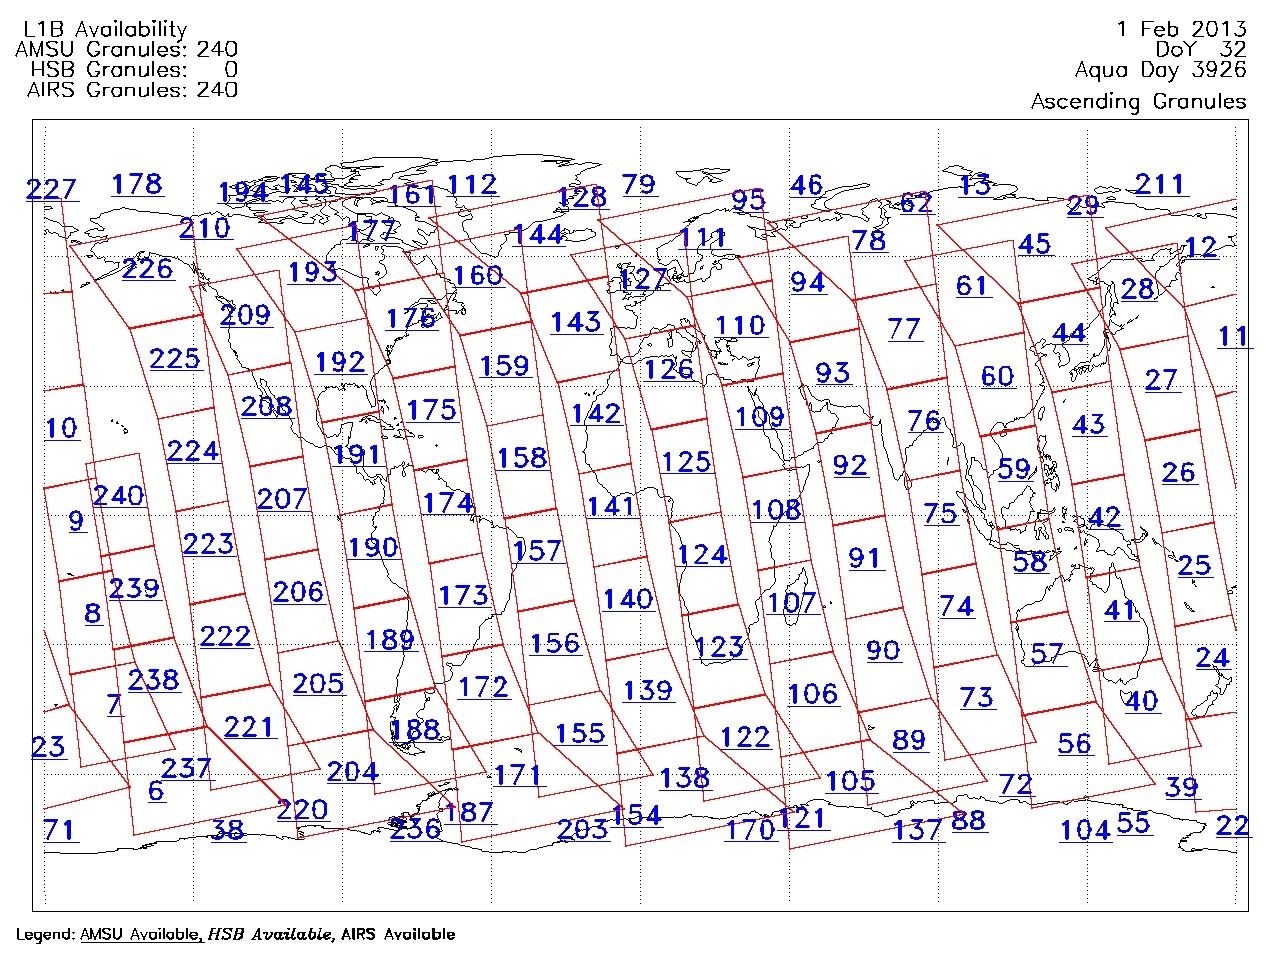
Figure 6 shows all the AIRS data granule locations from 1 February 2013. Granule locations vary with time, though repeat every 16 days, but with ~7 km shifts when leap seconds occur.
|
|
|
 |
|


Figure 6: AIRS/AMSU/HSB Granules for 1 February 2013.
Top left: ascending granules Top right: descending granules
Bottom left: Arctic granules Bottom right: Antarctic granules
Examples of AIRS/AMSU/HSB and Vis/NIR Imagery
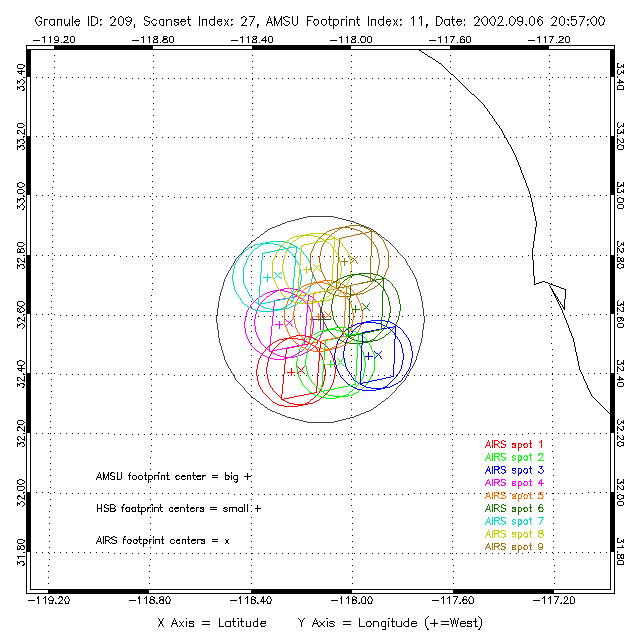
As shown in Figure 2 and discussed above, each AMSU‑A footprint encompasses 9 AIRS and HSB footprints arranged in 3 by 3 grids. This arrangement is illustrated further in Figure 7, which was produced from the AIRS geolocation information for September 6, 2002, just off the coast of Southern California. The large circle represents the 3.3 degree solid angle width (not geographic size) footprint of an AMSU‑A observation. The smaller colored circles represent the 1.1 degree footprints of the associated arrays of AIRS and HSB observations. The colored rhombuses represent the areas covered by the associated arrays of Vis/NIR pixels.

Figure 7: AIRS/AMSU/HSB Footprint Pattern Sept 6, 2002; granule 209; AMSU scanline 27; footprint 11, central (lat,lon) = (32.6°, -118.1°), just west of San Diego, California.
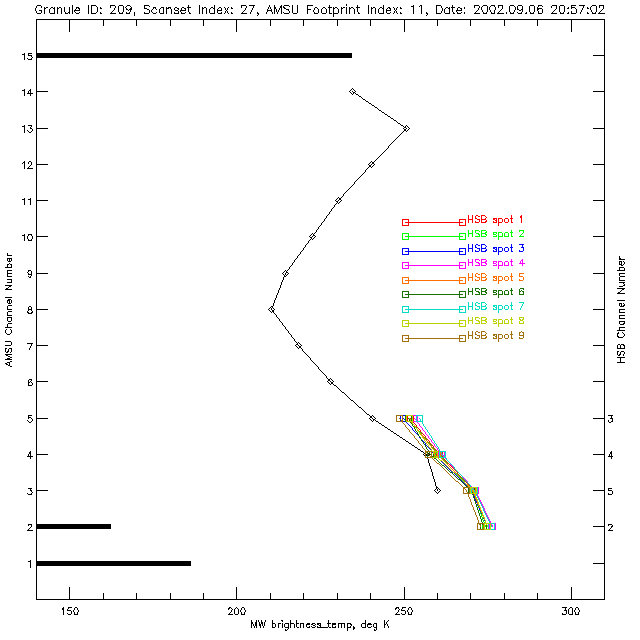
Figure 8 shows the combined AMSU and HSB spectra for the example scene shown in Figure 7. Channel number is shown along the vertical axes (AMSU to the left and HSB to the right), and the horizontal axis represents brightness temperature.
The AMSU temperature sounding channels (3‑14) are connected with line segments, and that plot can be viewed as a rudimentary representation of the temperature profile. The lowest channel is affected by the surface, however, which depresses the brightness temperature relative to the atmospheric temperature for this oceanic scene. AMSU channels 1, 2, and 15 are plotted separately as bars in Figure 8, since they are window channels that are primarily influenced by the surface brightness (i.e. the product of surface temperature and emissivity).
Ocean emissivity is very low for channels 1 and 2, which causes very low brightness temperatures, even though the SST is relatively high. Channel 1 is warmer than channel 2 because it is affected by water vapor and clouds, which elevates the brightness temperature over the apparent cold ocean background. Channel 15 is warmer still, due to a higher emissivity as well as higher sensitivity to both water vapor and clouds.
HSB has four channels, and of its nine fields of view within the single AMSU field of view, resulting in the nine line plots shown to the right in Figure 7. The vertical order of the channels reflects the order of altitude of the maximum radiance source (peak of the weighting function) rather than the serial channel number. These channels essentially reflect the atmospheric temperature near the peaks of the water vapor/liquid weighting functions.
The lowest channel (#2) peaks near the surface (but has slightly lower brightness temperature than the surface due to the emissivity). The highest channel (#3), which is too opaque to have much influence from the surface, has a brightness temperature somewhere between AMSU channels 4 and 5, which suggests it peaks at perhaps 850 mb. The spread between the nine plots suggests there is some (but not much) variability in water vapor and liquid water in the scene.

Figure 8: Microwave Radiances (AMSU-A and HSB). Sept 6, 2002; granule 209; scanline 27; footprint 11.
Figure 9 shows the nine AIRS infrared radiance spectra from the example scene in the previous figures. The brightness temperature in the 900 cm−1 region varies from about 260 K to 290 K. The spectra are obtained over ocean so conditions are relatively uniform, with the exception of cloud properties. Thus, the variability of brightness temperature in Figure 8 is mostly due to the effect of clouds.
Note the slope of the coldest spectrum (color‑coded brown) in the 900 cm−1 region. Since cloud tops tend to be colder than the surface, this is most likely the cloudiest of the nine AIRS footprints; spectral slope is a signature of cirrus clouds. This spectrum also appears to reflect more short wavelength solar radiance than other AIRS spectra (i.e., higher brightness temperature in the 2600 cm−1 spectral region).
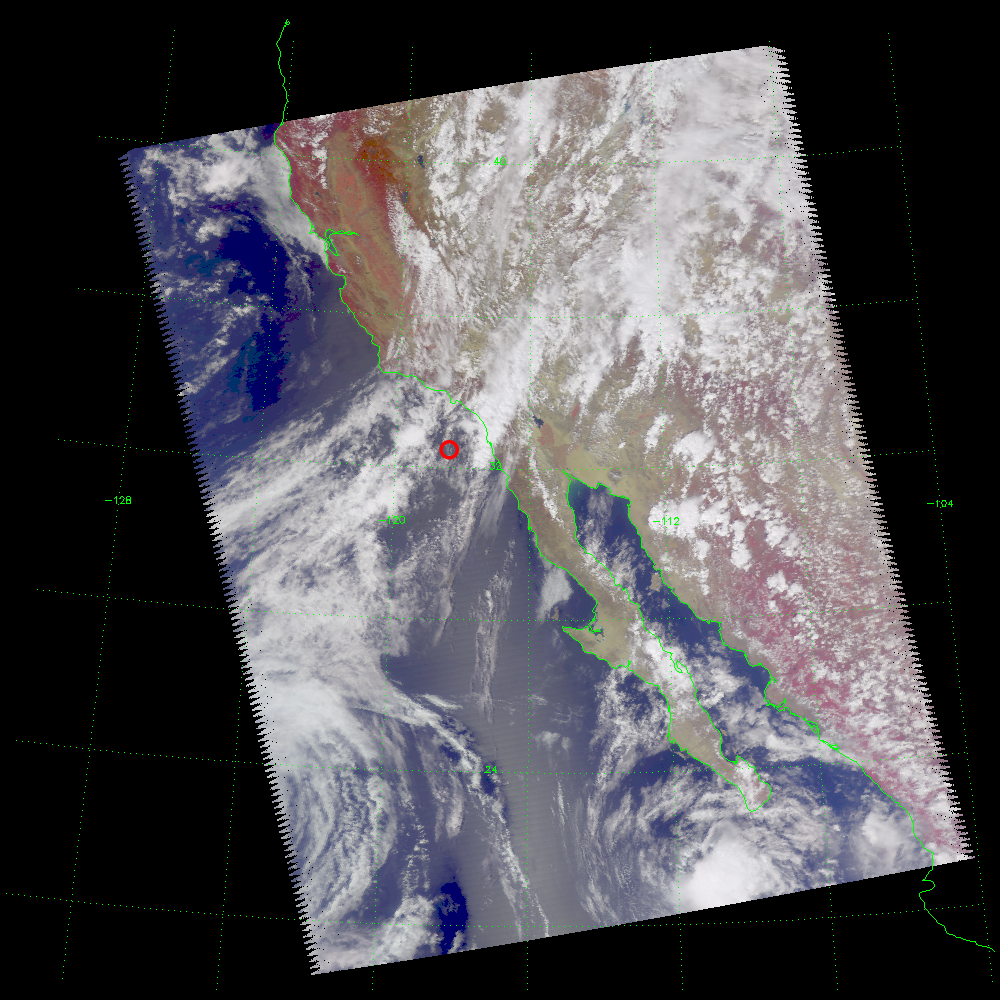
Figure 10 is a Vis/NIR image of granule 209, showing the mixed clouds typical of the troposphere.

Figure 9: Infrared Radiance Spectra (AIRS). Sept 6, 2002; granule 209; scanline 27; footprint 11.

Figure 10: False color image of Sept 6, 2002 Granule 209 constructed from Vis/NIR radiances. The red circle shows the approximate outline of the example AMSU field of view from the previous three figures.