Carbon Dioxide
Jump to: Key Questions | Overview | Preparing CO2 Retrievals for Applications | CLIMCAPS Product Field Names | References
Background
CLIMCAPS retrieves profiles of CO2 mixing ratio [ppm] on the same fixed 100 vertical pressure layers and spatial footprints as all the other trace gas species from a few dozen cloud cleared AIRS or CrIS channels in the long-wave infrared (IR) band around 666–750 cm−1 wavenumber (~14.3 μm).
Key Questions
How can I access CLIMCAPS CO2 retrievals?
CLIMCAPS CO2 retrievals are part of the main Level 2 product file that is generated and archived by the NASA Goddard Earth Sciences Data and Information Services Center (GES DISC).
CLIMCAPS retrieves CO2 as mixing ratio [ppm] on pressure layers (air_pres_lay) but the Level 2 product file reports CO2 as volumetric mixing ratio (co2_vmr) on pressure levels (air_pres), which is the mole of CO2 per mole of dry air [mol/mol]. There are CO2 retrievals at every retrieval scene (~50 km at nadir and ~150 km at edge-of-scan), twice a day from each instrument ascending and descending orbits.
Even though the product is distributed as Level 2, we strongly advise against using CLIMCAPS CO2 the way it is available in these files, i.e., at 100 pressure layers for every retrieval footprint. Instead, we recommend that you integrate the profile vertically, and apply spatial and temporal averaging.
In Section 1 below we discuss how CLIMCAPS CO2 retrievals at single footprint resolution are dominated by random variability in temperature, H2O vapor, clouds, ozone and others. In Section 2.2 we illustrate how this random variability due to spectrally interfering variables can be reduced with data aggregation and in Section 2.5 highlight a few applications for which CLIMCAPS CO2 may be useful once it is aggregated in space and time.
Can I use CLIMCAPS CO2 retrievals for studying climate trends?
We strongly discourage you from deriving long-term trends of T(p) or CO2 with CLIMCAPS products. Why? Because the IR spectral channels sensitive to CO2 emissions are the same ones also sensitive to small T(p) variation. This means that the retrieval of long-term trends in T(p)—on the order of ~0.1 K per decade —depends on accurate knowledge of CO2 decadal patterns, which is difficult to know globally. In turn, the retrieval of CO2 mixing ratio strongly depends on knowledge of T(p) at every scene (See Section 1).
In CLIMCAPS V2 we take a different approach to AIRS V.7 by having a reanalysis model, MERRA2, as a-priori for T(p) (Gelaro et al., 2017; GMAO, 2015). AIRS V.7 uses a non-linear statistical regression (Milstein and Blackwell, 2016; Susskind et al., 2014) as T(p) a-priori that is calculated at run-time, with the effect that the a-priori at each footprint is independent of its neighbors. There is, thus, no a-priori spatial structure. MERRA2 T(p), on the other hand, has strong spatial structure and meso-scale gradients of T(p) in the troposphere and stratospheres. With a MERRA2 as T(p) a-priori, the CLIMCAPS T(p) retrieval thus has spatial, temporal and vertical structure built into it. We argue that with an accurate estimate of T(p) as starting, CLIMCAPS should have an improved ability to separate CO2 from T(p) in the spectral channels.
We refer the reader to a different retrieval system, specifically designed to detect long-term trends (Strow and DeSouza-Machado, 2020).
1. Overview
Infrared instruments such as AIRS and CrIS are sensitive to atmospheric temperature at multiple pressure layers through CO2 emissions (Maddy, 2007; Strow and DeSouza-Machado, 2020).
Even though both CO2 and temperature have distinct spectral signatures (Figure 2, Figure 3, and Figure 4), they are very difficult to separate spectrally because the IR channels typically used for retrieving temperature are also highly sensitive to CO2 emissions. Stated differently, the longwave IR channels that give us information about CO2 mixing ratio in the stratosphere (~666 cm−1) and mid-troposphere (~730 cm−1) are also highly sensitive to small variations in temperature at a target scene. CO2 is a well-mixed gas, both spatially and vertically, which means that its variation from scene-to-scene and day-to-day is low. In CLIMCAPS, as in many other IR retrieval systems, we wrestle with the problem of how to retrieve a slow changing gas species from spectral channels with interference from fast changing variables such as temperature. We discussed a similar problem with CH4 and H2O in the mid-wave IR band elsewhere.
Here, we give a brief overview of the CLIMCAPS CO2 product to help guide interpretation and application. For an in-depth look, we refer the reader to work by Eric Maddy on the challenges and approaches to CO2 retrievals from AIRS (Maddy, 2007b, 2007a, 2009, 2010; Maddy and Barnet, 2008). The figures we present here are simplifications of the analysis Eric Maddy performed, to illustrate why we urge users to treat CLIMCAPS CO2 products with caution, not to diagnose and contrast AIRS or CrIS instrument capability or deep-dive into the theory of signal-inversion.
1.1 Sensitivity of the infrared spectrum to CO2
AIRS and CrIS each have hundreds of IR channels with information about many atmospheric variables. Despite the relatively high spectral resolution of these instruments, their channels remain highly mixed signals where each channel is sensitive to multiple variables at any given point in space-time. We design retrieval systems to separate these spectral measurements into distinct atmospheric variables, but have to contend with the difficulty of quantifying uncertainty, interference, signal and noise for each channel and each retrieval variable. It is nearly impossible to do this accurately for all variables under all conditions.
CLIMCAPS retrieves many IR absorbing trace gas species for a number or reasons; (i) to support Earth system process studies with coincident observations of many atmospheric variable, (ii) improve CLIMCAPS retrieval of temperature and H2O and, (iii) enable the calculation of outgoing longwave radiation, a climate variable that requires knowledge of the full atmospheric state.
As mentioned, the retrieval of CO2 and temperature are closely linked because their spectral signatures overlap in both the shortwave [~2150–2550 cm−1] and longwave [~650–1100 cm−1] IR bands (Figure 1 and Figure 2). In CLIMCAPS, we select subsets of IR channels for each retrieval variable separately. For CO2, we select those that characterize the core of CO2 absorption lines in the longwave band to effectively compute the derivative of the spectral area which is proportional to the amount of CO2 in the atmosphere. For temperature we select those channels that are sensitive to the sides of the CO2 absorption lines because they are the ones with narrow vertical kernel functions (Kaplan et al., 1977). Channels on the sides of absorption lines also tend to have less sensitivity to CO2.
Our philosophy in CLIMCAPS is to select as many channels as possible with narrow kernel functions to promote high vertical resolution in the retrieval of a target variable, but at the same time promote stability (high precision) under all types of conditions of any given global day.
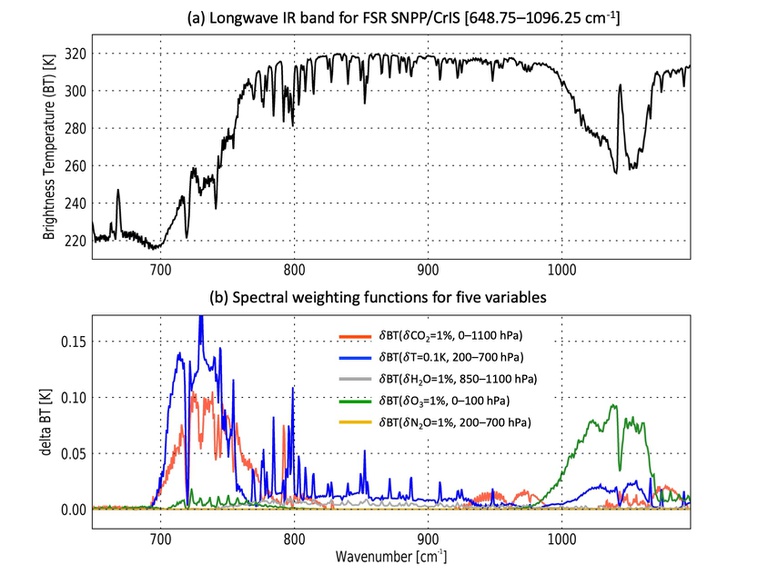
In Figure 1 and Figure 2 we plot the spectral signatures for five CLIMCAPS retrieval variables, namely CO2, temperature, H2O, O3 and N2O, in the long- and shortwave IR CrIS bands, respectively. We calculate these with the stand-alone AIRS radiative transfer model known as SARTA (Strow et al., 2003) for the CrIS full spectral resolution mode. With spectral ‘signatures’, we mean spectral fingerprints, –kernels, –weighting functions or –Jacobians. Here we calculate spectral kernel functions, K, as the absolute change in brightness temperature (BT) given a change in state variable, i.e., \( \frac{ \delta y}{ \delta x } \), where \(y\) is the simulated TOA radiance converted to BT [K] at scene temperature, and \(x\) is the state variable:
where F is the SARTA forward operator and p the perturbation factor. In Figure 1 and Figure 2, we perturb the gas species by 1%, thus , and temperature by 0.1 K, thus . Kernels are typically 2-D matrices with dimensions [m x n], where m is the number of spectral channels and n the number of pressure layers. Our brute force kernels in Figure 1 and Figure 2 have n = 1 because we perturb the target variable along a single broad layer for the sake of simplicity and illustration. In retrieval systems, 1 < n ≤ 100 to maximize information content and vertical resolution, given system constraints. See Smith and Barnet (2023) where we broaden the discussion of these spectral signatures.
Notice in Figure 1, how the temperature kernel (blue) overlaps the CO2 kernel (red), which means that CrIS channels sensitive to CO2 emissions, are also sensitive to variation in temperature. More specifically, the temperature and CO2 spectral signatures in Figure 1 show us that the spectral signature for a ~4 ppm (1% of ~400 ppm) change in CO2 along the full vertical column is roughly the same shape and magnitude as a 0.1 K change in mid-tropospheric temperature. The fact is that CO2 does not change by 4 ppm on a daily basis from scene to scene but instead takes years to change by that much. Temperature, on the other hand, can easily vary by several Kelvins at small spatial scales and across the span of several minutes to hours.
For CLIMCAPS V2, we selected channels for CO2 retrieval from the 666 – 750 cm−1 wavenumber (~14.3 μm) range. Second to clouds, temperature is the strongest source of uncertainty in CO2 retrievals. None of the other variables, such as stratospheric O3 (green), boundary layer H2O or mid-tropospheric N2O cause significant spectral interference in the ~14.3 µm region.
There are some differences in CO2 channel selection between CLIMCAPS-Aqua and CLIMCAPS-SNPP/-NOAA20 that we have not homogenized yet, but adopted straight from their legacy systems, such as AIRS V6. We refer the reader to our section that highlights system differences (i.e., CLIMCAIS-AIRS vs -SNPP vs -NOAA20) and issues that may affect the continuity of CLIMCAPS retrieval products across these different instruments and satellite platforms.
Figure 1: Simulated CrIS spectra using SARTA (Strow et al., 2003). (a) Longwave band [648.75 – 1096.25 cm−1] of top of atmosphere CrIS spectrum at full spectral resolution (FSR), given CLIMCAPS retrieval scene (1,1) from granule 104 on 1 April 2018. (b) Five spectral signatures or Kernel functions to illustrate channel sensitivity to a change in the target variable as dBT/dx according to Eq. 1. They are, (red) 1% perturbation in column CO2 [0 – 1100 hPa], (blue) 0.1 K perturbation in mid-tropospheric temperature [200 – 700 hPa], (grey) 1% perturbation for lower tropospheric H2O [850 – 1100 hPa], (green) 1% perturbation to stratospheric O3 [0 – 100 hPa], and (yellow) 1% perturbation to mid-tropospheric N2O.
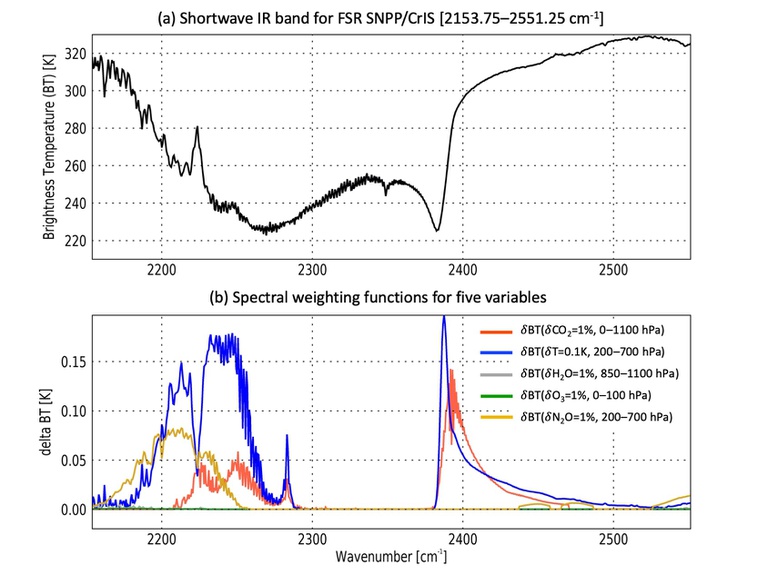
Even though CLIMCAPS V2 selects its CO2 channels from the longwave band in the 14.3 µm range, we plot spectral signatures for the CrIS shortwave band in Figure 2 (~4.5 µm) to illustrate what these spectral kernels (Eq. 1) look like for the same five variables. Note that CO2 is not radiatively active in the mid-wave IR band, thus its omission in this chapter, but we refer the reader to our CH4 chapter for a discussion of the mid-wave IR band.
Again, we see a strong spectral overlap between the temperature and CO2 kernels, with a near-identical signature ~2390 cm−1 (Figure 2) for a daytime scene (ascending orbit, ~13h30 local overpass time). Unlike the longwave band (Figure 1), N2O has a strong signature that overlaps with that of temperature and CO2 in the ~2200 cm−1 range.
Figure 2: Same as Figure 1 but for the full spectral resolution (FSR) CrIS shortwave band [2153.75 – 2551.25 cm−1]
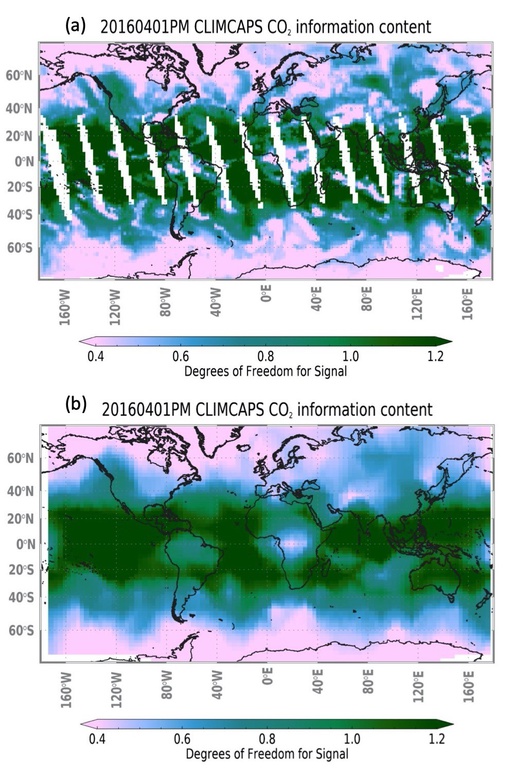
We can visualize CLIMCAPS-SNPP information content as ‘degrees of freedom’ (DOF) for its CO2 retrievals using the co2_dof field to further illustrate how temperature affects CO2. In Figure 3a, with DOF on a 1.5-degree global grid, we see high spatial variability, much higher than what we can reasonably expect the ~14.3 µm channels to have for CO2 with < 1 ppm (< 0.25%) variation across latitudinal zones on any given day.
When we aggregate DOF (co2_dof) onto a 12-degree global grid (i.e., averaging all values binned into single grid cell), we gain a more realistic representation. Statistical averaging reduces random noise, so by averaging CLIMCAPS CO2 DOF, we reduce random uncertainty caused by channel sensitivity to large fluctuations in temperature.
Figure 3: Information content as ‘degrees of freedom’ for CLIMCAPS-SNPP CO2 retrievals (co2_dof) from full spectral resolution cloud cleared CrIS radiances for an ascending orbit (13h30 local overpass time) as a global equal-angle grid on (a) 1.5˚ resolution, close to single footprint size in the lower latitudes at edge of scan, and (b) 12˚ resolution as spatial aggregates (multiple values in the same grid cell were simply averaged). We did not apply any quality control filtering (co2_vmr_qc) since the averaging kernels (ave_kern/co2_ave_kern) from which DOF is derived are unaffected by the quality of the retrieval. DOF, instead, characterizes the potential a sounding system has in retrieving a target variable (Smith and Barnet, 2020). Results presented here are for CLIMCAPS-SNPP CO2 retrievals on 1 April 2016. This is a different day of retrievals from those used in calculating the spectral kernel functions of Figure 1 and Figure 2.
Degrees of freedom quantifies the number of independent pieces of information that exists within a retrieval system about a target variable. In Figure 3, we see CO2 DOF approximate 1.0 in the low latitudes, with values below 0.4 at high latitudes. This means that CLIMCAPS-SNPP V2 has at most one piece of information about CO2 in the atmospheric column. This can be misleading because it does not mean that all the information is concentrated in one single pressure layer. Fractions of the total DOF can be from different parts of the atmosphere.
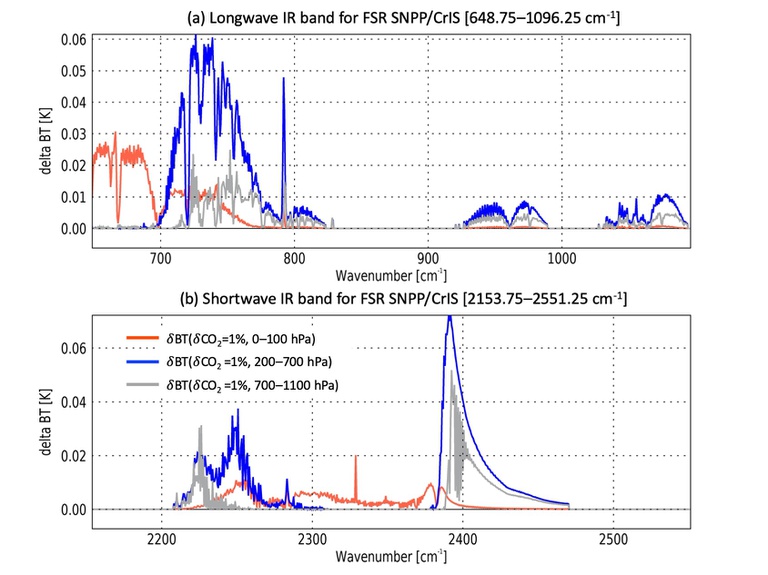
In Figure 1 and Figure 2, we calculated the spectral kernel functions for a 1% change in total column CO2. We repeat the same calculation (Eq. 1) for the same scene in Figure 4, but this time perturb the CO2 profile at three vertical layers to illustrate spectral sensitivity to CO2 emissions from different parts of the atmosphere.
In Figure 4a and Figure 4b, respectively, we compare CO2 spectral functions in the longwave [648.75–1096.25 cm−1] and shortwave [153.75–2551.25 cm−1] IR bands for (red) 1% perturbation in stratospheric CO2 [0–100 hPa], (blue) 1% perturbation in mid-tropospheric CO2 [200–700 hPa] and (gray) 1% perturbation in lower-tropospheric CO2 [700–1100 hPa].
Figure 4: Same as Figure 1, but for (red) 1% perturbation in stratospheric CO2 [0–100 hPa], (blue) 1% perturbation in mid-tropospheric CO2 [200–700 hPa] and (gray) 1% perturbation in lower-tropospheric CO2 [700–1100 hPa].
Figure 4a depicts a clear separation in kernels for CO2 emissions in the stratosphere (red) versus mid-troposphere (blue). Sensitivity to lower tropospheric CO2 emissions (grey) is mostly masked by the stronger sensitivity to CO2 in the mid-troposphere (blue). So, while CLIMCAPS-SNPP has DOF ≈ 1.0 (Figure 3), the information we can retrieve about CO2 emissions is typically smaller than that, closer to CrIS instrument noise.
CLIMCAPS uses ~57 CrIS channels selected from the longwave band in wavenumbers ranging 660–790 cm−1 to help improve signal-to-noise, but weigh these channels inversely to their estimated random instrument noise (NEdT). In this sense, CLIMCAPS uses the systematic signal of the entire band to retrieve CO2 and accounts for random instrument and retrieval noise.
Note that we are attempting to retrieve CO2 with IR channels only, while retrieving temperature using IR and microwave (~57 GHz) channels. This is has been the standard approach in AIRS Science Team in NUCAPS and AIRS V6. In addition to these measurements, CLIMCAPS does use MERRA2 as a-priori for temperature retrievals, and with that draws on the wealth of information assimilated from different sources, such as all the available space-based microwave and IR instruments, GPS-RO, radiosondes and model dynamics (i.e., the solution that balances momentum, energy, and density conservation).
With an accurate representation of temperature as background state variable in CO2 retrievals (i.e., background state variables are used to calculate the kernel matrix, Eq. 1), we argue that CLIMCAPS may allow a better, more robust, separation of CO2 and temperature from channels in the ~14.3 µm band because temperature is well known.
When compared to CO2 retrievals from systems that use statistical regressions as a-priori for temperature, such as AIRS V6, we already see a much improved, more realistic, spatial representation for CLIMCAPS CO2 without the ‘salt-and-pepper’ effect of random noise that a statistical temperature a-priori introduces into subsequent CO2 retrievals.
1.2 Regularization of the CO2 retrieval
In this section we highlight some of the techniques we apply to regularize (or stabilize) the CO2retrieval. With this we wish to give the reader a sense of the CLIMCAPS algorithm and mathematical tools we apply to ensure a robust product. For a more thorough description of these techniques, we refer the reader to (Smith and Barnet, 2019, 2020)
CLIMCAPS applies a singular value decomposition (SVD) to its spectral kernel functions that are normalized by the measurement error covariance matrix at run-time to separate the signal (i.e., information about the target variable) from the noise (i.e., interfering species, which for CO2 would be temperature). Each kernel decomposes into an eigenvector with associated eigenvalue, λ. The degree to which each eigenvector (or transformed kernel function) contributes to the retrieval is determined by λ, which we compare against a static threshold λc (Note: λc ≡ 1/co2wgt, with co2wgt defined as a constant variable in the CLIMCAPS namelists). When λ/λc < 1 the eigenvectors are damped proportionally as discussed in detail in (Smith and Barnet, 2020). When λ/λc < 5% CLIMCAPS simply returns the a-priori because the S/N is deemed too low. When λ/λc > 1 the eigenvectors are not damped and thus used without any regularization in the retrieval.
Most of this calculation is done dynamically at run-time for each radiance measurement and each retrieval variable, but the one static value we derive offline is co2wgt, which determines the critical threshold, λc, which in turn determines how much each eigenvector contributes to the retrieval and how much of the retrieval would ultimately depend on the a-priori. The smaller (larger) the co2wgt value, the more the retrieval depends on the radiance measurements (a-priori). Other factors affecting how CLIMCAPS weighs the contribution of the measurements to the final solution include the number of spectral channels selected for use in retrieval, how many trapezoid functions are defined for calculation of the K matrix and known errors like instrument noise, radiative transfer bias and so on.
In CLIMCAPS V2, co2wgt = 0.38 for AIRS and CrIS. We recognize that this may not be an optimal configuration since CrIS has apodized radiances with highly correlated S/N which may cause a higher degree of damping than AIRS radiance. We will address this in follow-on upgrades to the CLIMCAPS system to promote a stronger continuity in CO2 retrievals between the AIRS and CrIS records. With co2wgt = 0.38, λc = 2.6, which means that only those eigenvectors with eigenvalues greater than 2.6 will contribute to the retrieval undamped. We adopted this value for co2wgt from the AIRS V6 system, but with MERRA2 as temperature a-priori in CLIMCAPS V2 and thus a better spatial structure as background, we need to reconsider this value in future version as it may be too low, meaning that the information in each CrIS/AIRS measurement may be over-damped for CO2.
Deriving an optimal value for co2wgt, however, is a classic Backus-Gilbert trade-off curve. For CLIMCAPS we want to find those values of co2wgt that minimize the error. If co2wgt is too large, the retrieval becomes the a-priori with minimal information contributed by the measurements. If co2wgt is too small, the retrieval depends primarily on the radiance measurements, as represented by the transformed kernel functions, or eigenvectors. But only those eigenvectors with λ ≥ 1.0 contain information about the target variable. Eigenvectors with λ < 1.0 are dominated by noise. A co2wgt that is too small, allows these noisy eigenvectors to contribute to the retrieval undamped. If co2wgt = 0 it is equivalent to an unconstrained least square fit and the retrieval error can then exceed the error in the a-priori itself.
In Table 1 we compare three different systems, all related to each other, but designed for different applications. There is NUCAPS (NOAA-Unique Combined Atmospheric Product System), based on the AIRS V5 code, that runs operationally at NOAA to support real-time weather forecasting (Esmaili et al., 2020; Weaver et al., 2019). Then, there is the legacy AIRS V6 system available at GES DISC for the full AIRS mission (AIRS Science Team/Joao Texeira, 2013).
Table 1: Comparing NUCAPS, AIRS version 6 and CLIMCAPS retrievals
|
NUCAPS |
AIRS v.6 | CLIMCAPS | |
|
Temperature a-priori |
Regression | Neural Network | MERRA2 |
| CO2 a-priori |
Global CO2(t) |
none |
Global CO2(t) |
| Latency | NRT | NRT | ~1 month |
| Ave. Kernels | NO | Yes (partial) | Yes |
| Detection flags | NO | NO | Yes |
Table note: NUCAPS uses a linear regression for temperature retrievals, a global climatology for CO2 that scales linearly over time, is available in near real-time (NRT), has no averaging kernels in its product file and no minor constituent detection flags. The AIRS V6 system uses a non-linear regression (or neural net NN) for temperature retrievals, does not have a distinct CO2 a-priori, is available in NRT with partial averaging kernels. CLIMCAPS uses MERRA2 as temperature a-priori, has the same CO\climatology a-priori as NUCAPS, is not available in NRT but instead lags by a month (due to MERRA2), has the full averaging kernel matrices available at each retrieval footprint for each retrieval variable and has detection flags for minor constituent.
2. Preparing CO2 retrievals for applications
2.1 Boundary layer adjustment
CLIMCAPS uses a standard 100-layer pressure grid to retrieve atmospheric variables from Earth surface (1100 hPa) to top of atmosphere (0.005 hPa). This pressure grid is required by radiative transfer models (SARTA for CLIMCAPS) to accurately calculate top of atmosphere hyperspectral IR radiances.
CLIMCAPS uses the exact same pressure grid at every scene on Earth and accounts for surface pressure as a separate variable during radiative transfer calculations. The retrieved CO2 profiles are, however, reported on the 100-level grid as a means to standardize the output. It is important that you adjust the bottom level, i.e. that pressure level closest to the Earth surface as identified by air_pres_lay_nsurf in the CLIMCAPS netCDF file, to accurately reflect the total number of CO2 molecules. Both CO2 (co2_vmr) and Temperature (air_temp) are retrieved on pressure levels (air_pres), so their boundary adjustment is for the pressure level closest to surface pressure . All other atmospheric gases are retrieved on pressure layers (air_pres_lay) and their boundary layer adjustment is for the pressure layer intersecting surface pressure.
2.2 Aggregation over pressure, space and time
We calculate total column values for CLIMCAPS CO2 mixing ratio profiles (co2_vmr) as the mean of co2_vmr(i, j, 1:100) across all pressure layers, where i is the across-track (scanline) index and j the along-track (footprint) index (Section 3).
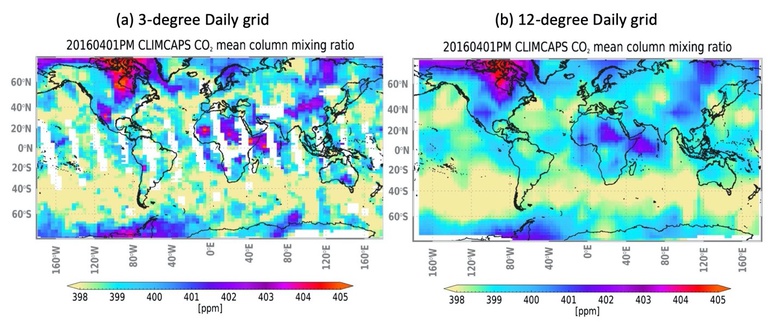
The netCDF file reports co2_vmr in SI units [mol/mol], but we convert this to ‘parts per million’ with a multiplication by 10e+06 before averaging. In Figure 5 and Figure 6, we depict column mean mixing ratio for CO2 [ppm] across different space-time grids. Figure 5a has high spatial variability compared to Figure 5b, where mean(co2_vmr) values were calculated over larger grid cells; 12-degrees versus the 3-degree grid averaging in Figure 5a. Averaging reduces random variability, which explains why the spatial gradients in Figure 5b are smoother.
Clouds is a major source random variability in CO2 retrievals, thus the majority of spatial structure in Figure 5a can be attributed to scene-dependent uncertainty.
Figure 5: CLIMCAPS-SNPP CO2 retrievals as column mean mixing ratio [ppm] for all ascending orbits (13h30 local overpass time) on 1 April 2016 aggregated to (a) 3-degree equal-angle grid and, (b) 12-degree equal angle grid.
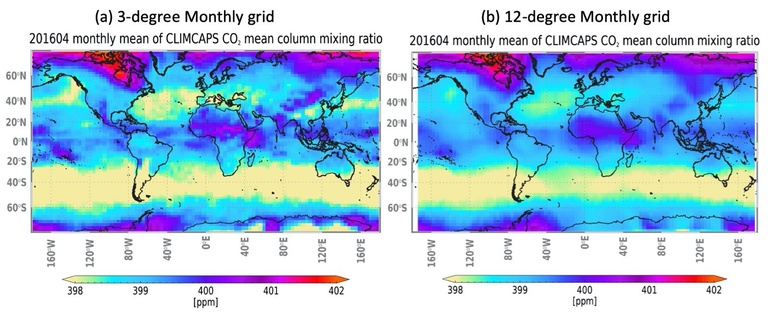
In Figure 6, we calculated a monthly mean from the daily grids in Figure 5, by averaging both ascending and descending orbits for all days from 1–30 April 2016. We distinguish ‘spatial aggregation’ (averaging within grid cells) from ‘temporal aggregation’ (averaging across days) and note that temporal aggregation should be carefully considered. AIRS in Aqua and CrIS on SNPP and NOAA-20 only have two orbits per day – one at night and one during the day – so diurnal signals need to be considered. On any given day, these instruments have much more measurements about global spatial variability than temporal variability.
The true test of this product would be in its ability to discern CO2 gradients, over time and space (Maddy, 2007b). More analysis is required to determine the skill of CLIMCAPS CO2, whether it matches gradients from other measurements over shorter timescales, and to better understand (inter/intra) product error correlations as a function of space-time (Maddy, 2007b).
Figure 6: CLIMCAPS-SNPP CO2 retrievals as column mean mixing ratio [ppm] averaged across all orbits (ascending and descending) from 1–30 April 2016 aggregated to (a) 3-degree equal-angle grid and, (b) 12-degree equal angle grid.
CLIMCAPS CO2 is a new product and we will continue to evaluate and improve it. Here we demonstrate V2 capability. Our philosophy is to not hide any results, but to honestly communicate the strengths and weaknesses of our system, where there is room for improvement, and how observations should be interpreted. We encourage the reader to evaluate CLIMCAPS CO2 products, communicate their results, not only to the science community in general, but share their findings, concerns and requirements with us as developers so that we may continue to improve observing capability.
2.3 CO2 a-priori
CO2 is the only gas that CLIMCAPS retrieves as volume mixing ratio [ppm] on pressure levels, not layer column density [molec/cm2] on pressure layers. The a-priori for CO2 is a single value, independent of pressure, and simple linear fit with no seasonal or latitudinal dependence, which is calculated as follows:
Where b = 371.92429, c = 1.8406018, t0= 2002.0, and ti = year +( month)/12.0). Erik Maddy (Maddy, 2007a) developed this linear fit that we still use today. While this CO2 a-priori is static throughout the vertical column, the CLIMCAPS CO2 retrieval has variation along the 100-level pressure grid according to the information retrieved from the Level 1 radiance measurements. CLIMCAPS applies a 2% a-priori error.
There is room for improvement and we will consider two alternative approaches in future. One is being developed by Juying Warner at the University of Maryland. Warner (2020) argues for latitudinal and seasonal in a CO2 climatology to improve the representation of gradients as a-priori for CLIMCAPS. Alternatively, on a given day we could create a CO2 a-priori from spatially and temporally averaged CLIMCAPS retrievals from the previous day or two.
2.4 Do NOT use CLIMCAPS CO2 products for these applications
Long term trends in CO2 cannot be calculated from CLIMCAPS CO2 retrievals.
In essence, we will always have a maximum of about ~50% of the signal coming from our radiances and that is only in the easiest cases (clear, tropical lapse rates, etc.). We cannot reasonably expect to fully capture the trend (~2 ppm/year) or seasonal cycle (~3 ppm peak-to-peak) of CO2 from IR measurements. We do, however, expect our CO2 product to capture some of the inter-annual, seasonal, and regional variability.
When using CLIMCAPS CO2 retrievals, keep in mind that they do not quantify boundary layer sources and sinks at city, county, or state level. Instead, they characterize CO2 in the mid-troposphere at regional spatial scales as shown by the averaging kernels.
2.5 Consider using CLIMCAPS CO2 products for these applications
After spatial and temporal aggregation, we anticipate that CLIMCAPS CO2 products can add value to a number of applications. The test report by Tao et al. (2022) should provide additional insights.
- Data assimilation as discussed in (Engelen and Bauer, 2014).
- Continental-scale process studies: CLIMCAPS retrieves mid-tropospheric CO2 at every cloud-cleared footprint with a global yield of 75% (i.e., retrievals that pass quality control) from ascending (day) and descending (night) orbits.
- Tracer-tracer correlations: CLIMCAPS retrieves O3, CO, CO2, CH4, HNO3, N2O, and SO2 from a single instrument measurement, which means that they are not only coincident in space and time but also thermodynamically consistent. Then, CLIMCAPS calculates minor constituent detection flags (isoprene, propylene, ethane, ammonia) to provide additional guidance on sources. See (Pan et al., 2006, 2007) for examples.
- Global quick looks: CLIMCAPS V2 generates atmospheric state variables from all measurements made by AIRS/AMSU on Aqua as well as CrIS/ATMS on S-NPP, and NOAA-20 (JPSS-1). It is a fast, robust system that can provide quick-look imagery that highlights areas for more in-depth study and targeted observations.
- Verification of model transport models such as (Peters et al., 2007) and (Kawa, 2004).
3. CLIMCAPS product field names relevant to CO2 applications
Within the netCDF files, the following fields are relevant for CO2 studies. Each CLIMCAPS file contains 45 scanlines along track (atrack) and 30 FOR along each scanline, or across track (xtrack). With CO2 profiles retrieved at each FOR on 100 pressure layers (air_pres_lay), the arrays have dimensions [atrack, xtrack, airs_pres_lay].
3.1 Retrieved variables
- aux/co2_vmr: Volume mixing ratio in SI units [mol/mol] with respect to dry air. You can convert this to parts per million [ppm] by multiplying with 10e-06.
3.2 Quality metrics
- aux/ispare_2: Quality control flag indicating whether a retrieval failed or succeeded a series of tests, with 0 = successful, ≥ 1 = failed.
- ave_kern/co2_ave_kern: CO2 averaging kernel.
- co2_dof: CO2 degrees of freedom.
4. References
- AIRS Science Team/Joao Texeira: Aqua AIRS L2 standard retrieval product using AIRS IR and AMSU, without-HSB V6, , doi:10.5067/AQUA/AIRS/DATA201, 2013.
- Engelen, R. J. and Bauer, P.: The use of variable CO2 in the data assimilation of AIRS and IASI radiances: Variable CO 2 in Infrared Radiance Assimilation, Quarterly Journal of the Royal Meteorological Society, 140(680), 958–965, doi:10.1002/qj.919, 2014.
- Esmaili, R. B., Smith, N., Berndt, E. B., Dostalek, J. F., Kahn, B. H., White, K., Barnet, C. D., Sjoberg, W. and Goldberg, M.: Adapting Satellite Soundings for Operational Forecasting within the Hazardous Weather Testbed, Remote Sensing, 12(5), 886, doi:10.3390/rs12050886, 2020.
- Gelaro, R., McCarty, W., Suárez, M. J., Todling, R., Molod, A., Takacs, L., Randles, C. A., Darmenov, A., Bosilovich, M. G., Reichle, R., Wargan, K., Coy, L., Cullather, R., Draper, C., Akella, S., Buchard, V., Conaty, A., da Silva, A. M., Gu, W., Kim, G.-K., Koster, R., Lucchesi, R., Merkova, D., Nielsen, J. E., Partyka, G., Pawson, S., Putman, W., Rienecker, M., Schubert, S. D., Sienkiewicz, M. and Zhao, B.: The Modern-Era Retrospective Analysis for Research and Applications, Version 2 (MERRA-2), Journal of Climate, 30(14), 5419–5454, doi:10.1175/JCLI-D-16-0758.1, 2017.
- GMAO: MERRA-2 inst3_3d_asm_Nv: 3d,3-Hourly,Instantaneous,Model-Level,Assimilation,Assimilated Meteorological Fields V5.12.4, , doi:10.5067/WWQSXQ8IVFW8, 2015.
- Kaplan, L. D., Chahine, M. T., Susskind, J. and Searl, J. E.: Spectral band passes for a high precision satellite sounder, Applied Optics, 16(2), 322, doi:10.1364/AO.16.000322, 1977.
- Kawa, S. R.: Global CO 2 transport simulations using meteorological data from the NASA data assimilation system, Journal of Geophysical Research, 109(D18), doi:10.1029/2004JD004554, 2004.
- Maddy, E. S.: Investigations of the spatial and temporal resolutions of retrievals of atmospheric CO2 from the Atmospheric InfraRed Sounder (AIRS), Ph.D, University of Maryland., 2007a.
- Maddy, E. S.: Update on NOAA CO2 retrievals: Validation and future direction, [online] Available from: https://airs.jpl.nasa.gov/documents/science_team_meeting_archive/2007_10/slides/maddy_astm_071010.pdf, 2007b.
- Maddy, E. S.: AIRS V6: NOAA’s perspective, [online] Available from: https://airs.jpl.nasa.gov/documents/science_team_meeting_archive/2009_10/slides/maddy_astm_091016.pdf, 2009.
- Maddy, E. S.: Status of AIRS V6 upgrades at NOAA/NESDIS, [online] Available from: https://airs.jpl.nasa.gov/documents/science_team_meeting_archive/2010_04/slides/100422_maddy_astm.pdf, 2010.
- Maddy, E. S. and Barnet, C. D.: Vertical Resolution Estimates in Version 5 of AIRS Operational Retrievals, IEEE Transactions on Geoscience and Remote Sensing, 46(8), 2375–2384, doi:10.1109/TGRS.2008.917498, 2008.
- Milstein, A. B. and Blackwell, W. J.: Neural network temperature and moisture retrieval algorithm validation for AIRS/AMSU and CrIS/ATMS: NEURAL NETWORK T AND Q VALIDATION, Journal of Geophysical Research: Atmospheres, 121(4), 1414–1430, doi:10.1002/2015JD024008, 2016.
- Pan, L. L., Konopka, P. and Browell, E. V.: Observations and model simulations of mixing near the extratropical tropopause, Journal of Geophysical Research, 111(D5), doi:10.1029/2005JD006480, 2006.
- Pan, L. L., Wei, J. C., Kinnison, D. E., Garcia, R. R., Wuebbles, D. J. and Brasseur, G. P.: A set of diagnostics for evaluating chemistry-climate models in the extratropical tropopause region, Journal of Geophysical Research, 112(D9), doi:10.1029/2006JD007792, 2007.
- Peters, W., Jacobson, A. R., Sweeney, C., Andrews, A. E., Conway, T. J., Masarie, K., Miller, J. B., Bruhwiler, L. M. P., Petron, G., Hirsch, A. I., Worthy, D. E. J., van der Werf, G. R., Randerson, J. T., Wennberg, P. O., Krol, M. C. and Tans, P. P.: An atmospheric perspective on North American carbon dioxide exchange: CarbonTracker, Proceedings of the National Academy of Sciences, 104(48), 18925–18930, doi:10.1073/pnas.0708986104, 2007.
- Smith, N. and Barnet, C. D.: Uncertainty Characterization and Propagation in the Community Long-Term Infrared Microwave Combined Atmospheric Product System (CLIMCAPS), Remote Sensing, 11(10), 1227, doi:10.3390/rs11101227, 2019.
- Smith, N. and Barnet, C. D.: CLIMCAPS observing capability for temperature, moisture, and trace gases from AIRS/AMSU and CrIS/ATMS, Atmos. Meas. Tech., 13, 4437–4459, https://doi.org/10.5194/amt-13-4437-2020, 2020.
- Smith, N., and Barnet, C. D.: CLIMCAPS – A NASA long-term product for infrared + microwave atmospheric soundings, Earth and Space Sci. 10, https://doi.org/10.1029/2022EA002701, 2023.
- Strow, L. L. and DeSouza-Machado, S.: Establishment of AIRS climate-level radiometric stability using radiance anomaly retrievals of minor gases and sea surface temperature, Atm. Meas. Tech. https://doi.org/10.5194/amt-13-4619-2020, 2020.
- Strow, L. L., Hannon, S. E., De Souza-Machado, S., Motteler, H. E. and Tobin, D.: An overview of the AIRS radiative transfer model, IEEE Transactions on Geoscience and Remote Sensing, 41(2), 303–313, doi:10.1109/TGRS.2002.808244, 2003.
- Susskind, J., Blaisdell, J. M. and Iredell, L.: Improved methodology for surface and atmospheric soundings, error estimates, and quality control procedures: the atmospheric infrared sounder science team version-6 retrieval algorithm, Journal of Applied Remote Sensing, 8(1), 084994, doi:10.1117/1.JRS.8.084994, 2014.
- Wang, Tao and Payne, V. H.: Testing report for the CLIMCAPS-Aqua V2.39 and AIRS V7 Level-3 monthly gridded composition products. Jet Propulsion Laboratory. Available online, 2022.
- Weaver, G., Smith, N., Berndt, E. B., White, K. D., Dostalek, John. F. and Zavodsky, B. T.: Addressing the Cold Air Aloft Aviation Challenge with Satellite Sounding Observations, Journal of Operational Meteorology, 138–152, doi:10.15191/nwajom.2019.0710, 2019.

