Methane
Jump to: Overview | Preparing CH4 Retrievals | CLIMCAPS Product Field Names | References
Background
CLIMCAPS retrieves profiles of CH4 layer densities [molec/cm2] on the same fixed 100 vertical pressure layers and spatial footprints as all the other trace gas species. CLIMCAPS retrieves CH4 from a subset of hyperspectral infrared channels selected from cloud cleared AIRS or CrIS radiance measurements in the fundamental ʋ4 mid-wave infrared (IR) band around 1292-1306 cm−1 wavenumber (7.6 μm). We refer to this CLIMCAPS product where values are reported for each retrieval or scenes as ‘Level 2’ to distinguish it from the ‘Level 1’ radiance measurements and the ‘Level 3’ global, gridded aggregates.
Key Questions
How can I access CLIMCAPS CH4 retrievals?
CLIMCAPS CH4 retrievals are part of the main Level 2 product file that is generated and archived by the NASA Goddard Earth Sciences Data and Information Services Center (GES DISC). CLIMCAPS CH4 retrievals are available at every retrieval scene, twice a day from each instrument (ascending and descending orbits).
Which retrievals should I avoid?
Generally, avoid using CLIMCAPS CH4 retrievals in the boundary layer, upper troposphere or stratosphere because CLIMCAPS has very low sensitivity to CH4 at pressures greater than ~700 hPa. The CLIMCAPS product file has a range of quality control indices and diagnostic metrics. CLIMCAPS does not have quality control metrics specifically set up for CH4, but instead adopts the logic that if retrievals of temperature and H2O fail (usually due to uniform cloud fields), then CH4 should also be considered a failed retrieval. CLIMCAPS retrieves CH4 after it retrieves temperature, H2O, O3, HNO3 and CO. You can customize the quality control filters according to different sources of uncertainty, such as those associated with the retrieval scene, instrumentation, background state or algorithm metrics. The most valuable algorithm metric to consider is the CH4 degrees of freedom discussed below.
How do I interpret the spatial variability of daily CH4 retrievals?
The 1300 cm−1 wavenumber range has strong absorption features for both CH4 and H2O molecules. This means that the subset of IR channels CLIMCAPS use for CH4 retrievals are also strongly sensitive to H2O. The spectral signals of these two gases are thus highly correlated. We adopted a sequential retrieval approach in CLIMCAPS and select channels specifically sensitive to the target gas but even then, fail to completely remove the correlation between CH4 and H2O. Atmospheric CH4 has low variability from day to day, while H2O has high variability even on an hourly basis. Much of the variability observed in CLIMCAPS CH4 retrievals from orbit to orbit can (and should) be attributed to variation in H2O. It is only when you aggregate CLIMCAPS CH4 retrievals in space (4.0˚ grids) and time (monthly) that you average out random uncertainty from H2O.
Which type of applications are CLIMCAPS CH4 good for?
We recommend that you interpret Level 2 CLIMCAPS CH4 products with caution since much of the daily variability can be attributed to H2O variability despite efforts to minimize the correlation between CH4 and H2O in the inversion of spectral channels. The CLIMCAPS CH4 product is thus not suitable for applications that require instantaneous, single-footprint observations. While, CH4 has a lifetime of ~10 years and a long-term record of satellite observations could potentially be useful in studying global trends, we advise against employing CLIMCAPS CH4 for that purpose because IR measurements in general have very low sensitivity to CH4 in the boundary layer (where anthropogenic sources occur) and CLIMCAPS, as observing system, has low sensitivity to CH4 in the mid- to upper troposphere due to a number of factors, such as choice in regularization parameters as well as error propagation. We envisage CLIMCAPS CH4 retrievals to have value in atmospheric process studies where the full atmospheric state – CLIMCAPS retrievals of temperature, H2O, trace gases and clouds – are considered.
Note that the main reason we retrieve CH4 within CLIMCAPS is to improve the H2O vapor retrieval in the troposphere because CH4 absorption is significant in this spectral region. In version 2.0, CLIMCAPS uses the CH4 climatology a-priori (Section 2.3) as background state variable in its H2O retrieval; however, in future we may use the CLIMCAPS CH4 retrieval to improve retrievals of tropospheric H2O vapor.
1. Overview
IR instruments on space-borne platforms, such as AIRS on Aqua and CrIS on SNPP and NOAA-20, are not well suited to monitor CH4 sources and sinks because their top of atmosphere measured radiances have weak sensitivity to atmospheric CH4, which is limited to the mid- to upper troposphere (< 700 hPa). IR instruments have almost no sensitivity to CH4 in the boundary layer. The difficulty in IR space-based CH4 observation is compounded by the fact that the same spectral channels sensitive to CH4 (~1300 cm−1 wavenumber range) are also sensitive to H2O vapor, a gas that exists in far greater quantities than CH4 and results in a much stronger spectral signature (Figure 1 and Figure 2).
In Figure 1a we plot the full spectral resolution CrIS mid-wave band with values simulated by SARTA using a CLIMCAPS-SNPP state retrieval – scanline 1, footprint 1, ascending granule 101 on 1 April 2018 – of temperature, H2O vapor, trace gases, surface temperature and cloud parameters. In Figure 1b, we illustrate the spectral signatures of CH4 and H2O in this mid-wave infrared band as brightness temperature (BT) difference plots; the spectrum in Figure 1a is subtracted from a simulated spectrum using the same set of state variables, except for a percentage change in one of the target variables. In Figure 1a we investigate a 1% perturbation of CH4 and H2O vapor, respectively for the mid-troposphere (200–700 hPa) and lower troposphere (700–1100 hPa). For most spectral channels, H2O is the dominant signal.

Figure 1: (a) SARTA simulated full spectral resolution CrIS Mid-Wave band (1209.75 – 1751.25 cm−1) using a CLIMCAPS sounding retrieval as atmospheric state; specifically, the first retrieval (scanline=1, footprint=1) of granule number 104 on 1 April 2018 on an ascending orbit (13h30 local overpass time). The CrIS spectrum was simulated in radiance units [mW/m2/steradian/cm-1] and converted to brightness temperature [K] using scene temperature. (b) Absolute values of Brightness Temperature (BT) difference to illustrate absorption features for methane (CH4) and water (H2O) vapor given a 1% perturbation across different parts of the atmosphere. Red: 1% CH4 perturbation for mid-troposphere, 200–700h hPa. Blue: 1% CH4 perturbation for lower troposphere, 700-1100 hPa. Cyan: 1% H2O perturbation in mid-troposphere, 200–700 hPa. Green: 1% H2O perturbation in lower troposphere, 700-1100 hPa.
In Figure 2, we illustrate the strong spectral response in CrIS mid-wave IR channels when H2O vapor varies from 1% to 10% (a range easily achieved on a daily basis) in the tropospheric column 200–1100 hPa. The red line in Figure 2, is the CH4 spectral signature for a 1% perturbation along the same pressure range as H2O. The CH4 signal is spectrally overwhelmed by variation in H2O.
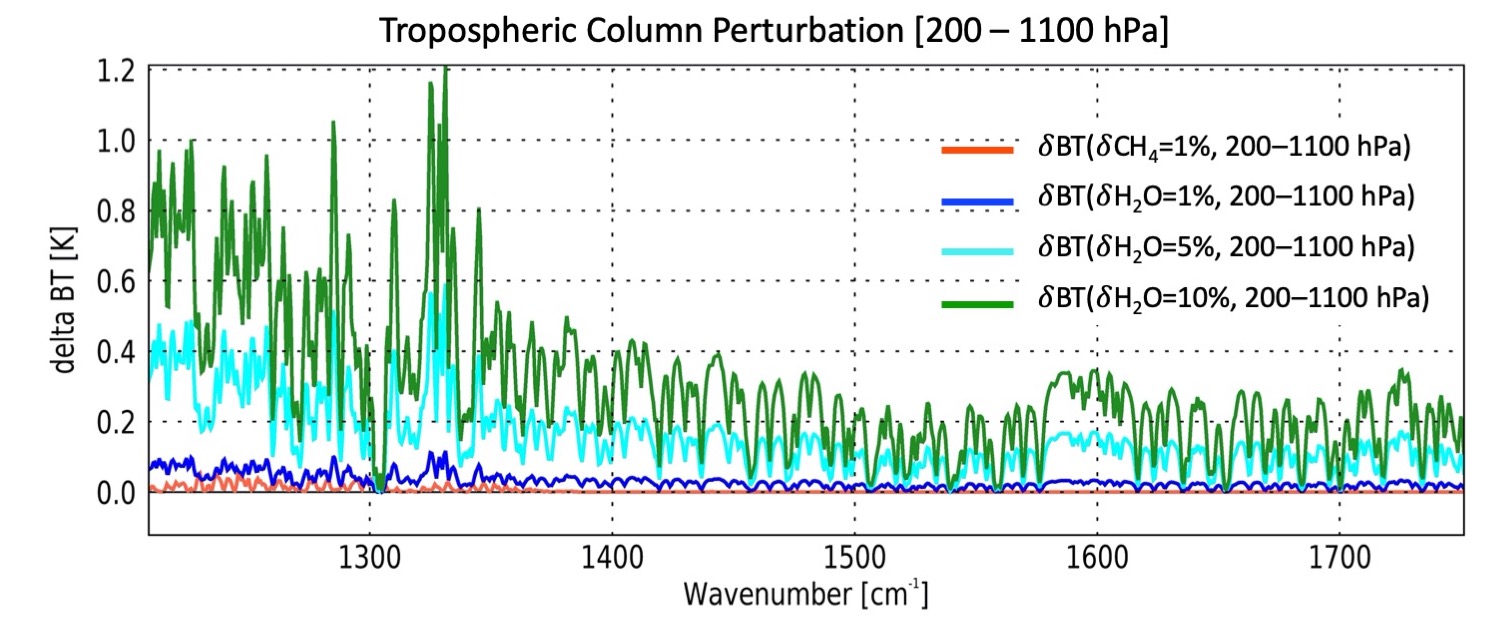
Figure 2: Same as Figure 1 but for absolute values of Brightness Temperature (BT) differences of CH4 and H2O across a single tropospheric layer (200–1100 hPa), with varying perturbation values for H2O. Red: 1% CH4 perturbation. Blue: 1% H2O perturbation. Cyan: 5% H2O perturbation. Green: 10% H2O perturbation.
Even without such obvious spectral overlap as seen for CH4 and H2O vapor (Figures 1 and Figure 2), it is difficult to decompose the highly correlated spectral measurement into distinct atmospheric variables. Space-based observation is especially challenging when you design a system like CLIMCAPS to retrieve a set of 9 distinct profile variables for all weather and climate conditions globally.
In CLIMCAPS we adopted a sequential retrieval approach as well as uncertainty quantification and propagation to enable robust retrievals of multiple atmospheric variables across a wide range of conditions (Smith and Barnet, 2019) but, even then, CH4 retrieval remains challenging. The use of MERRA-2 as a-priori for temperature and H2O helps CLIMCAPS mitigate the cross-correlation between CH4 and H2O vapor in the mid-wave IR band. Other sequential OE systems, such as AIRS V6 or NUCAPS, use statistical regressions implemented either as neural networks or linear retrievals that use all IR and microwave spectral channels.
When a system uses spectral channels twice in a retrieval (first to calculate its a-priori, and then to calculate its Bayesian solution), the strong spectral correlations are amplified and propagated. This is one of the reasons why you see large spatial variation in NUCAPS (or AIRS V7) CH4 retrievals. Another reason is that both AIRS V7 and NUCAPS iterate cloud clearing and thus propagate errors due to cloud estimation and removal through the regression retrieval into the final solution. We discuss the benefits of using MERRA 2 as CLIMCAPS a-priori for temperature and H2O in Table 2 of Smith and Barnet (2019).
Efforts to globally monitor CH4 sources, sinks and trends are stifled by a lack of measurements in general and where measurements do exist large inconsistencies prevail (Duren et al., 2019). Some space-borne instruments do show potential for monitoring CH4 globally with reports on CH4 source detection from TROPOMI (Hu et al., 2018; Pandey et al., 2019) and Hyperion on EO-1 (Thompson et al., 2016), both instruments with high spectral resolution short-wave infrared capability (~2.3 μm) and strong sensitivity to CH4 molecules in the boundary layer.
We anticipate that CLIMCAPS CH4 products may add value when used in conjunction with other data sources, such as those from TROPOMI, to add synoptic-scale information about mid- to upper-tropospheric CH4 patterns under certain conditions. For example, CLIMCAPS CH4 retrievals could compliment the monitoring of Amazonian CH4 (Bloom et al., 2016) or CH4 changes in the Arctic (Shakhova et al., 2010; Thornton et al., 2016).
Figure 3 depicts full-spectral resolution CLIMCAPS-SNPP CH4 retrievals as tropospheric column densities [molec/cm2] integrated over pressure layers between 200 and 700 hPa for all ascending orbits (13h30 local overpass time) on 1 April 2016. We binned the CLIMCAPS CH4 column densities to an equal-angle 1.5˚ grid and averaged all retrievals that passed quality control within each grid cell. From the netCDF Level 2 product file, we access the CLIMCAPS profile retrievals of CH4 in the mol_lay/ch4_mol_lay field, and quality control metrics in mol_lay/ch4_mol_lay_qc. We integrated and averaged all values where mol_lay/ch4_mol_lay_qc = 0 (i.e., best quality). Figure 3 closely resembles the spatial variability of Level 2 CH4 retrievals since CLIMCAPS footprints at edge of scan in the Tropics is ~1.5˚ and at nadir ~0.5˚.

Figure 3: CLIMCAPS-SNPP CH4 column density retrievals [molec/cm2] from full-spectral resolution CrIS integrated over mid- to upper tropospheric pressure layers between 200 and 700 hPa. The CLIMCAPS CH4 column densities were gridded and averaged on a 1.5-degree global grid to closely resemble variation at native product resolution in the Level 2 files. Note that the color scale is amplified to highlight spatial patterns mol_lay/ch4_mol_lay field, and quality control metrics in mol_lay/ch4_mol_lay_qc. We integrated and averaged all values where mol_lay/ch4_mol_lay_qc = 0 (i.e., best quality). Much of the variability in CH4 visible here can be attributed to variability in H2O vapor, another gas species radiatively active in the 1300cm-1 spectral range from which CLIMCAPS select its CH4 channels for retrieval. Compared to CH4, H2O has a stronger spectral signal which complicates the separation of these two gases during retrieval.
Overall, CLIMCAPS has lower values for CH4 in the Southern Hemisphere (Figure 3), which can partly be attributed to the a-priori that has a distinct North-South gradient (Section 2.3). Much of the daily tropospheric variability in CH4 visible in Figure 3 can, however, be attributed to variability in H2O vapor, which CLIMCAPS treats as an interfering gas and major source of uncertainty in its CH4 retrievals. CLIMCAPS retrieves CH4 only after it retrieved H2O vapor at the target scene to minimize this interference.
Figure 4 depicts CLIMCAPS-SNPP information content for CH4 using degrees of freedom (DOF) as metric. Here we do not see a North-South gradient, but instead a similar pattern of observability in the Northern and Southern Hemispheres. This is partly due to the fact that, unlike CH4 column densities (Figure 3), the DOF (Figure 4) contains no explicit knowledge of the CLIMCAPS CH4 a-priori.
Overall, full spectral resolution CLIMCAPS-SNPP has a DOF of ~0.7 for CH4 with values rarely exceeding 1.0 and sometimes falling below 0.4. This means that CLIMCAPS-SNPP generally has a weak ability to observe a tropospheric layer of CH4 (i.e., when DOF = 1.0) and most of the time contribute some information only to a partial column. CLIMCAPS CH4 information content is similar for all systems; CLIMCAPS-SNPP with normal spectral resolution CrIS, CLIMCAPS-NOAA20 and CLIMCAPS-Aqua.

Figure 4: CLIMCAPS-SNPP degrees of freedom (DOF) for CH4 from full-spectral resolution CrIS at every retrieval scene from ascending orbits (13h30 local overpass time) on 1 April 2016. DOF is an information content metric and quantifies how many pieces of information (or distinct vertical layers) CLIMCAPS can retrieve about CO at every scene. For most of the globe, CLIMCAPS has CH4 DOF < 1. We used the netCDF field ch4_dof and did not apply any quality filtering since DOF is not affected by retrieval outcome.
We can diagnose CLIMCAPS along the vertical atmospheric pressure gradient. Figure 5 depicts mean profiles (with standard deviation error bars) of (i) sensitivity to the true state given by the averaging kernel matrix diagonal, (ii) layer density retrievals and (iii) a-posteriori error for the North Polar region (> 60˚North). Figure 6 is similar to Figure 5 but for the Tropics (30˚South to 30˚North). Note how there are fewer vertical error bars on the averaging kernel profile (blue line) compared to the retrieval (orange line) and error (yellow line) profiles. This is because CLIMCAPS averaging kernels are calculated on a reduced set of pressure layers, defined by a series of overlapping trapezoids.
Note how the averaging kernels (blue lines) show that CLIMCAPS has maximum sensitivity to CH4 broadly around 400 hPa at high latitudes (Figure 5) and ~300 hPa at low latitudes (Figure 6).
The retrieval error profiles (yellow line) in Figure 5 and Figure 6 represent the diagonal vector of the a-posteriori error covariance matrix that CLIMCAPS generates for each retrieval variable at each field of regard. This error profile in the netCDF file (mol_lay/ch4_mol_lay_err) has the same units [molec/cm2] as the retrieval profile (mol_lay/ch4_mol_lay) so we could easily calculate the error as a percentage by dividing the error by the retrieval, multiplied by 100. This error does not represent the accuracy, bias, or error with respect to the true state, but instead is a representation of how much CLIMCAPS improved upon the a-priori error estimate, given system uncertainty.

Figure 5: A diagnosis of CLIMCAPS-SNPP CH4 retrievals for the North Polar latitudinal zone [>60˚N] on 1 April 2016. Each solid line represents the mean zonal profile and error bars the standard deviation at each pressure layer. [left] CLIMCAPS CH4 averaging kernel matrix diagonal vector from netCDF field ave_kern/ch4_ave_kern that indicates the pressure layers at which CLIMCAPS has sensitivity to the true state of CH4 in the atmosphere. [middle] CLIMCAPS CO profile retrieval from netCDF field mol_lay/ch4_mol_lay [molec/cm2]. [right] CLIMCAPS retrieval error from netCDF field mol_lay/ch4_mol_lay_err [molec/cm2] represented here as percentage [mol_lay/ch4_mol_lay_err]/[ mol_lay/ch4_mol_lay]*100. CLIMCAPS uses a CH4 a-priori error of 5% as represented by the thick grey line in panel on the right. A Bayesian Optimal Estimation retrieval system (like CLIMCAPS) typically reduces the a-priori error in all successful retrievals, In calculating these mean profiles, we filtered out all retrievals where mol_lay/ch4_mol_lay_qc(*,i,j) ≥ 1. We plot these profiles using the pressure layer array from air_pres_lay*100 in hPa units.

Figure 6: Same as Figure 3 but for the Tropical zone [30˚S to 30˚N].
CLIMCAPS defines a 5% error for its CH4 a-priori, which we indicate with the thick grey line in the right-hand panels of Figure 5 and Figure 6. Here we see that CLIMCAPS reduces the a-priori error to ~3% within the pressure layers defined by the averaging kernel. The retrieval error is a typical by-product of all systems using the Rodgers (2000) OE retrieval method and should be used as a metric for characterizing the observing system, not as a metric for defining the accuracy or bias of the retrieval itself (Smith and Barnet, 2019, 2020).
2. Preparing CH4 retrievals for applications
2.1 Boundary layer adjustment
CLIMCAPS uses a standard 100-layer pressure grid to retrieve atmospheric variables from Earth surface (1100 hPa) to top of atmosphere (0.005 hPa). This pressure grid is required by radiative transfer models (SARTA for CLIMCAPS) to accurately calculate top of atmosphere hyperspectral IR radiances. CLIMCAPS uses the exact same pressure grid at every scene on Earth and accounts for surface pressure as a separate variable during radiative transfer calculations. The retrieved profiles are, however, reported on the 100-layer grid as a means to standardize the output. It is important that you adjust the bottom layer, i.e. that pressure layer intersecting the Earth surface as identified by air_pres_lay_nsurf in the CLIMCAPS netCDF file, to accurately reflect the total number of CH4 molecules in the boundary layer.
This boundary layer adjustment is important if you calculate total column CH4 densities. This boundary layer adjustment is irrelevant if you work with CH4 retrievals in the mid-troposphere, above the boundary layer such as depicted in Figure 3.
2.2 Space-time averaging
CLIMCAPS CH4 retrievals must be aggregated in space and time before application to remove random uncertainty, specifically H2O vapor. Researchers at the NOAA Earth Systems Research Lab (ESRL) performed an in-depth study of the degree to which CH4 retrieved from space-borne IR systems should be aggregated using scale variance techniques (Frost et al., 2018; McKeen et al., 2016). For retrievals of CH4 from the NOAA-Unique Combined Atmospheric Processing System (NUCAPS) for CrIS on SNPP and NOAA-20 (a sister system to CLIMCAPS) Frost et al., (2018) and McKeen et al., (2016) determined that CH4 must be aggregated to spatial scales greater than ~340 km (which can roughly be translated to ~3.4˚ in the Tropics). A report describing their analysis and results is available upon request (Greg Frost, Gregory.J.Frost@noaa.gov, https://esrl.noaa.gov/csd/staff/gregory.j.frost/).
Below we demonstrate the value of space-time aggregation for CLIMCAPS CH4 retrievals by (i) increasing the grid size to 4.0 degrees lat/lon (Figure 7) and (ii) averaging a month of daily (ascending and descending orbits) CLIMCAPS CH4 observations (Figure 8).

Figure 7: Same as Figure 1 but with values spatially aggregated over a 4˚equal-angle grid.

Figure 8: Same as Figure 5 but with values temporally aggregated over a 4˚ equal-angle grid for a month of retrievals, ascending (13h30 local overpass time) and descending orbits (01h30 local overpass time), 1–30 April 2016.
2.3 CH4 a-priori
The CLIMCAPS CH4 a-priori (Figure 9) is derived from performing a non-linear fit based on coefficients trained on in-situ measurements (< 350 hPa) and chemistry model fields (> 350 hPa) from 2015. The coefficients were calculated off-line as described by Xiong et al., (2008, 2013) and the a-priori profiles are calculated for the retrieval scene’s latitude at run-time. The textfile containing the a-priori profiles is available for download.
Figure 9 depicts the CLIMCAPS CH4 a-priori as mixing ratio [ppb] across all latitudes, with higher values in the Northern Latitudes below 300 hPa. The greatest variability in CH4 occurs in the mid-troposphere with a large drop off above the tropopause. Unlike the CLIMCAPS a-priori’s for other retrieval variables, there is no temporal or longitudinal variability in the CH4 a-priori. therefore, any temporal or longitudinal structure in the CLIMCAPS methane product is derived from the observation itself. CLIMCAPS uses a 5% error for CH4 a-priori at all retrieval scenes.

Figure 9: CLIMCAPS CH4 a-priori mixing ratio [ppb] profiles calculated along each latitude from North to South. The CLIMCAPS CH4 a-priori is calculated from a set of coefficients and varies with pressure [hPa] and latitude. These coefficients were developed by Xiong et al., (2008, 2013).
Please note that improving the CLIMCAPS a-priori for CH4 retrieval is an area of ongoing research.
3. CLIMCAPS product field names relevant to CH4 applications
Within the netCDF files, the following fields are relevant for CH4 studies. Each CLIMCAPS file contains 45 scanlines along track (atrack) and 30 FOR along each scanline, or across track (xtrack). With CH4 profiles retrieved at each FOR on 100 pressure layers (air_pres_lay), the arrays have dimensions [atrack, xtrack, airs_pres_lay].
3.1 Retrieved variables
- mol_lay/ch4_mol_lay: This is the integrated column amount of CH4 from the top of the atmosphere (TOA = 0.005 hPa) to the surface. Note that the retrieval is typically only sensitive around 500 hPa, so this should be combined with the averaging kernel (ch4_ave_kern) to understand how this field differs from the first guess.
- mol_lay/ch4_mol_lay_err: Error estimate
3.2 Quality metrics
- mol_lay/ch4_mol_lay_qc: Profile quality control metrics ranging from 0 = good, 1 = suspect, 2 = bad.
- ave_kern/ch4_ave_kern: CH4 averaging kernel.
- ch4_dof The trace of the averaging kernel matrix as a measure of the number of pieces of information about the methane profile provided by the physical retrieval step. Degrees of freedom indicate the number of distinct vertical levels that the algorithm has sensitivity. For CH4, this is typically below 1.0.
4. References
- Bloom, A. A., Lauvaux, T., Worden, J., Yadav, V., Duren, R., Sander, S. P. and Schimel, D. S.: What are the greenhouse gas observing system requirements for reducing fundamental biogeochemical process uncertainty? Amazon wetland CH 4 emissions as a case study, Atmospheric Chemistry and Physics, 16(23), 15199–15218, doi:10.5194/acp-16-15199-2016, 2016.
- Duren, R. M., Thorpe, A. K., Foster, K. T., Rafiq, T., Hopkins, F. M., Yadav, V., Bue, B. D., Thompson, D. R., Conley, S., Colombi, N. K., Frankenberg, C., McCubbin, I. B., Eastwood, M. L., Falk, M., Herner, J. D., Croes, B. E., Green, R. O. and Miller, C. E.: California’s methane super-emitters, Nature, 575(7781), 180–184, doi:10.1038/s41586-019-1720-3, 2019.
- Frost, G. J., McKeen, S. A., Smith, N., Barnet, C. D., Ahmadov, R., Pierce, R. B., Ryerson, T. B., Holloway, J. S., Peischl, J., Pollack, I. B., McKain, K., Sweeney, C., Daube, B. C., Commane, R., Wofsy, S. C., Thompson, C. R. and Bourgeois, I.: Characterizing Tropospheric Trace Gas Retrievals from the Cross-track Infrared Sounder, in AGU Fall Meeting Abstracts, vol. 2018, pp. IN44B-06., 2018.
- Hu, H., Landgraf, J., Detmers, R., Borsdorff, T., Aan de Brugh, J., Aben, I., Butz, A. and Hasekamp, O.: Toward Global Mapping of Methane With TROPOMI: First Results and Intersatellite Comparison to GOSAT, Geophysical Research Letters, 45(8), 3682–3689, doi:10.1002/2018GL077259, 2018.
- McKeen, S. A., Angevine, W. M., Ahmadov, R., Frost, G. J., Kim, S. W., Cui, Y., McDonald, B., Trainer, M., Holloway, J. S., Ryerson, T. B., Peischl, J., Gambacorta, A., Barnet, C. D., Smith, N. and Pierce, R. B.: Mid-tropospheric Spectral Length-scale Analysis of Many Constituents from Aircraft, Satellite and Model Results During the 2013 SENEX Field Study., in AGU Fall Meeting Abstracts, vol. 2016, pp. IN31A-1746., 2016.
- Pandey, S., Gautam, R., Houweling, S., van der Gon, H. D., Sadavarte, P., Borsdorff, T., Hasekamp, O., Landgraf, J., Tol, P., van Kempen, T., Hoogeveen, R., van Hees, R., Hamburg, S. P., Maasakkers, J. D. and Aben, I.: Satellite observations reveal extreme methane leakage from a natural gas well blowout, Proceedings of the National Academy of Sciences, 116(52), 26376–26381, doi:10.1073/pnas.1908712116, 2019.
- Rodgers, C. D.: Inverse methods for atmospheric sounding: theory and practice, World Scientific, Singapore; Hackensack, N.J., 2000.
- Shakhova, N., Semiletov, I., Salyuk, A., Yusupov, V., Kosmach, D. and Gustafsson, O.: Extensive Methane Venting to the Atmosphere from Sediments of the East Siberian Arctic Shelf, Science, 327(5970), 1246–1250, doi:10.1126/science.1182221, 2010.
- Smith, N. and Barnet, C. D.: Uncertainty Characterization and Propagation in the Community Long-Term Infrared Microwave Combined Atmospheric Product System (CLIMCAPS), Remote Sensing, 11(10), 1227, doi:10.3390/rs11101227, 2019.
- Smith, N. and Barnet, C. D.: CLIMCAPS observing capability for temperature, moisture, and trace gases from AIRS/AMSU and CrIS/ATMS, Atmos. Meas. Tech., 13, 4437–4459, https://doi.org/10.5194/amt-13-4437-2020, 2020.
- Thompson, D. R., Thorpe, A. K., Frankenberg, C., Green, R. O., Duren, R., Guanter, L., Hollstein, A., Middleton, E., Ong, L. and Ungar, S.: Space-based remote imaging spectroscopy of the Aliso Canyon CH 4 superemitter: ORBITAL SPECTROSCOPY OF THE ALISO EVENT, Geophysical Research Letters, 43(12), 6571–6578, doi:10.1002/2016GL069079, 2016.
- Thornton, B. F., Geibel, M. C., Crill, P. M., Humborg, C. and Mörth, C.-M.: Methane fluxes from the sea to the atmosphere across the Siberian shelf seas: CH 4 FLUXES FROM SIBERIAN SHELF SEAS, Geophysical Research Letters, 43(11), 5869–5877, doi:10.1002/2016GL068977, 2016.
- Xiong, X., Barnet, C., Maddy, E., Sweeney, C., Liu, X., Zhou, L. and Goldberg, M.: Characterization and validation of methane products from the Atmospheric Infrared Sounder (AIRS), Journal of Geophysical Research, 113(null), doi:10.1029/2007JG000500, 2008.
- Xiong, X., Barnet, C., Maddy, E. S., Gambacorta, A., King, T. S. and Wofsy, S. C.: Mid-upper tropospheric methane retrieval from IASI and its validation, Atmospheric Measurement Techniques, 6(9), 2255–2265, doi:10.5194/amt-6-2255-2013, 2013