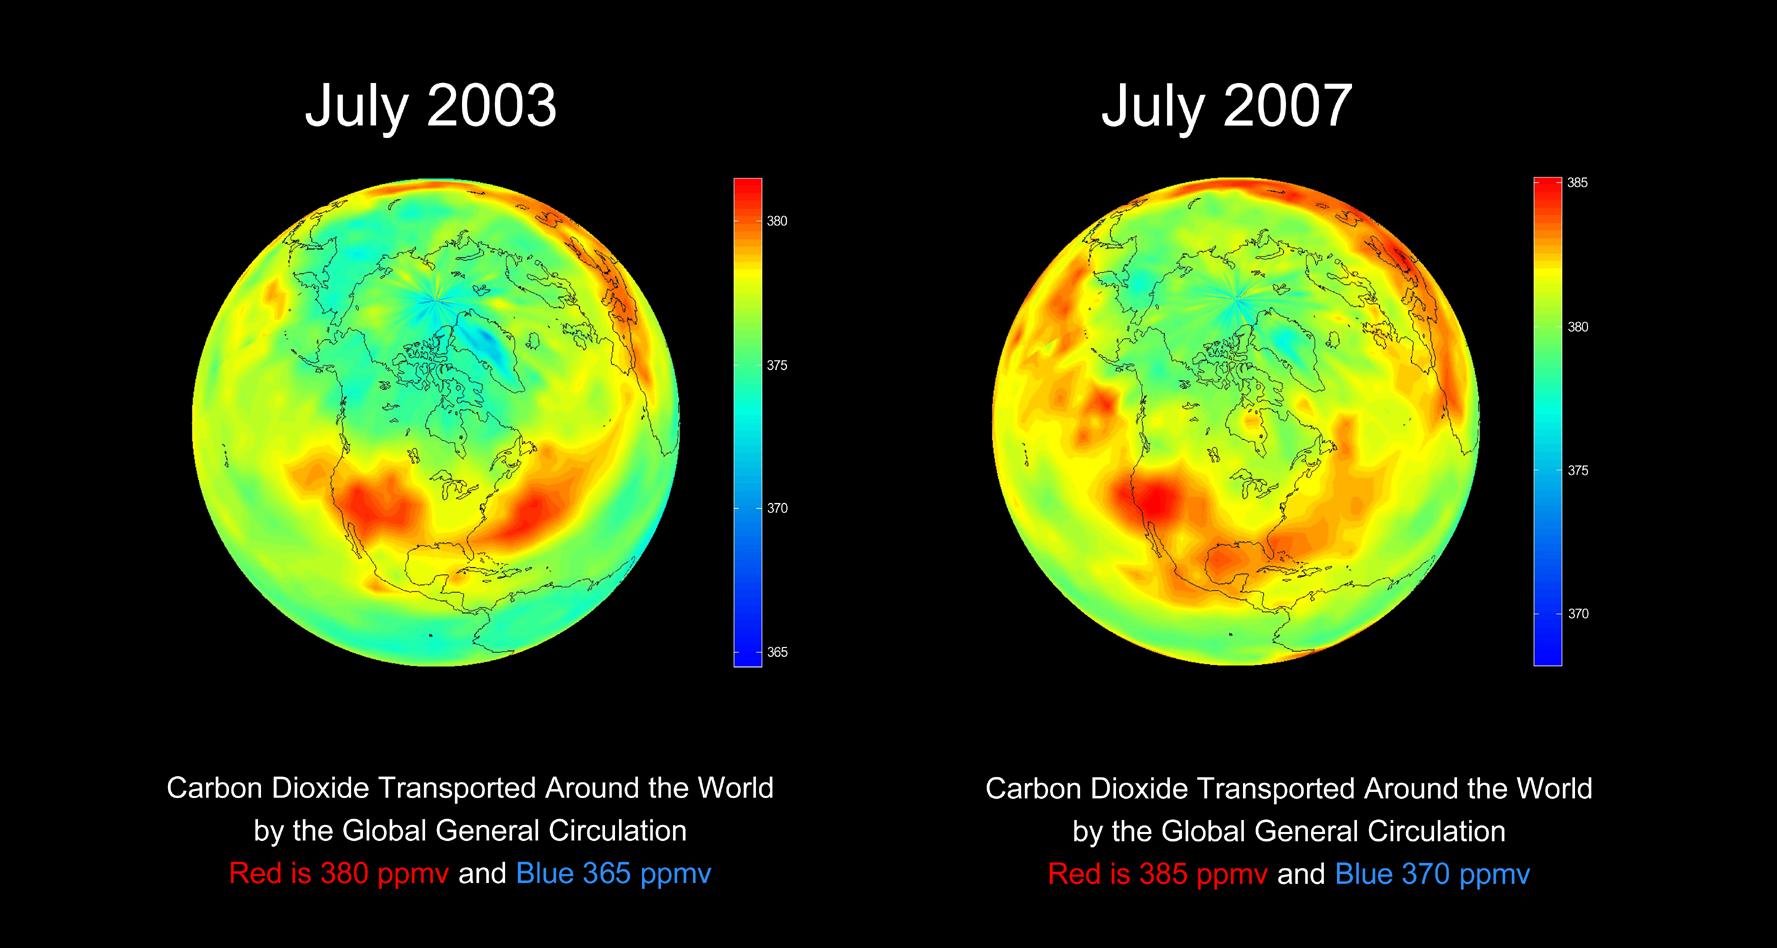
Mid-Tropospheric Carbon Dioxide at 8-13 km Altitudes, July 2003 and July 2007
Source:
Thomas Pagano, NASA-JPL/Caltech
Published:
November 20, 2019
Both images in the slide show the global spreading of carbon dioxide on the Earth globe as it follows the large scale patterns of the atmospheric general circulations. The color codes in these two images are different in order to account for the carbon dioxide increase from 2003 to 2007. The 2003 carbon dioxide image is the first global image to be derived from space observations. If the color bar for 2003 were to be used for 2007, the resulting 2007 map would be saturated with reddish colors, and the fine structure of the distribution of carbon dioxide obscured.
