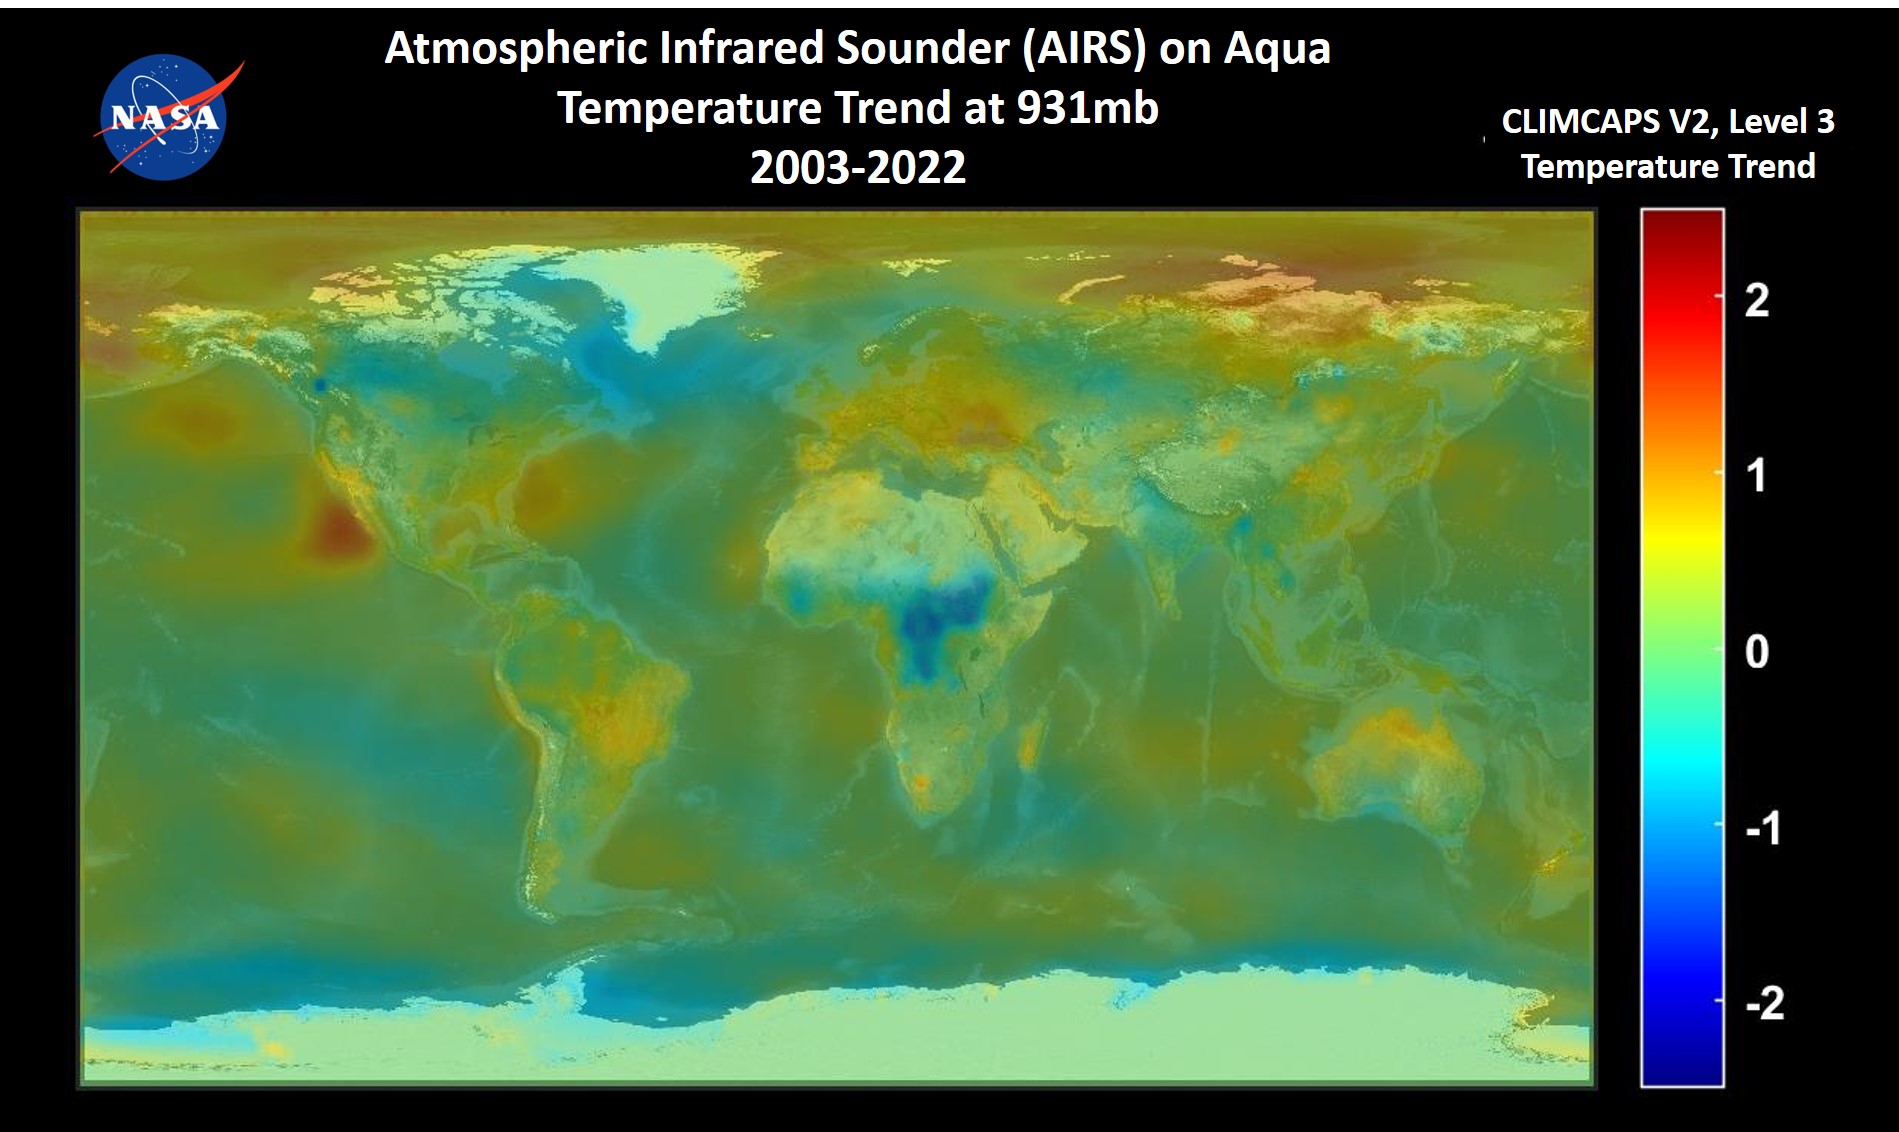
Global map of AIRS temperature trend from 2003 to 2022
Source:
Thomas Pagano, NASA-JPL/Caltech.
Published:
April 7, 2023
This image shows the trend in the AIRS monthly temperature anomaly from 2003 to 2022. The temperature anomaly is the difference in temperature for any given month from the mean temperature for all months in the entire time period. This image was produced using the CLIMCAPS-Aqua Level 3 air_temp product at vertical level 94, or 931 mb. Validation of trends seen in the AIRS data is an on-going process and results shown in this image are preliminary.
