News | December 23, 2022
AIRS Captures Extreme Cold Air Outbreak Sweeping Across North America
As a winter storm and severe cold sweeps across the US, with multiple low temperature records set, thousands of flights cancelled and millions of people from coast-to-coast under winter-weather alerts, NASA's AIRS instrument captured the evolving weather patterns and their larger context.
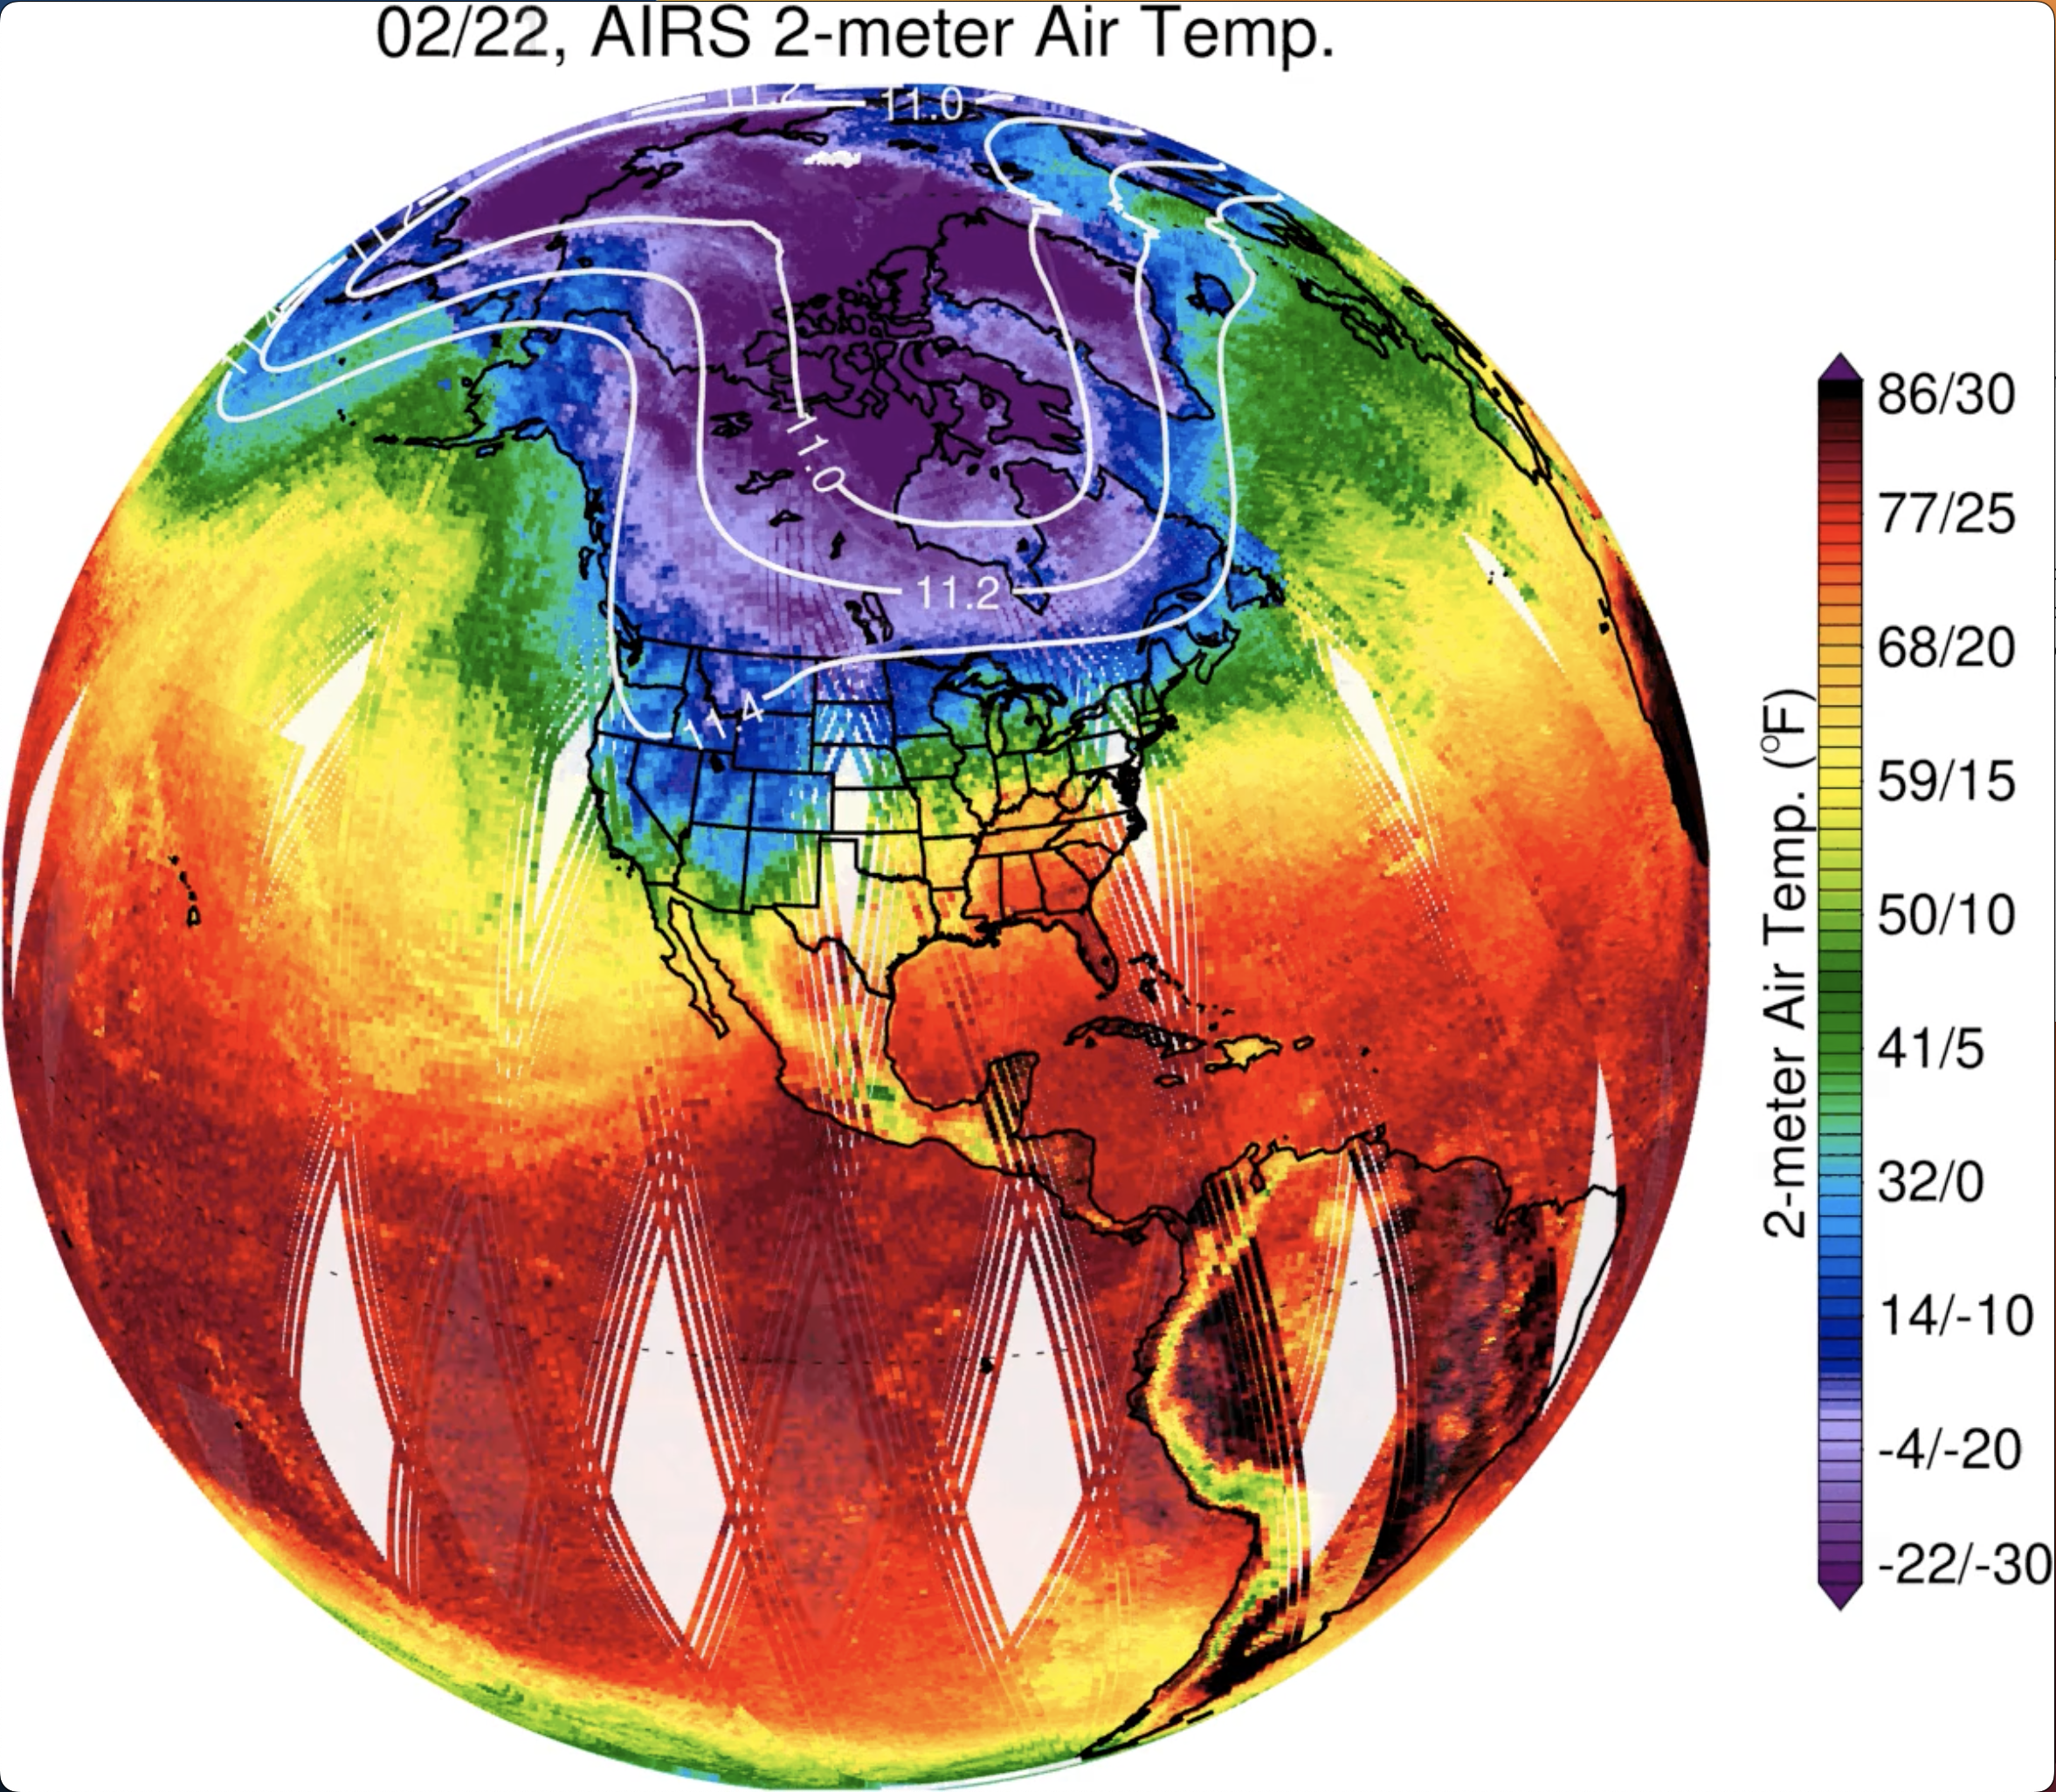
The animation above covers North America and its surroundings, over the time period from December 13th until December 22nd, 2022. The colors show air temperature near the surface. An area of cold surface air with low atmospheric pressure generally sits above the Arctic, as seen in the frame from December 13th, with the strong air current of the polar jet stream swirling counterclockwise above. But as the movie unfolds the polar jet stream meanders and a tongue of cold air reaches down south and breaks off, bringing the cold air from the Arctic well into the United States.
Overlaid white contour lines show geopotential height, the altitude in kilometers, of the 200 hPa pressure surface. Typical surface pressure is about 1000 hPa, and the 200 hPa height values shown (roughly 11 km) are above the tropopause in northern winter. Changes in this pressure height surface are a measure of disturbance of the polar vortex, with the 200 hPa contour and jet stream both normally forming a ring centered on the pole overlying cold surface air, as on December 13. The subsequent strong distortion of the 200 hPa height, accompanied by the very cold near-surface air temperatures, indicates a polar vortex disturbance extending over the entire depth of the troposphere.
In the maps, temperatures around freezing are shown in green, extending down into Texas by December 22nd. The coldest temperatures in the maps, shown in purple, reach down to minus 22 degrees Fahrenheit (minus 30 degrees Celsius).
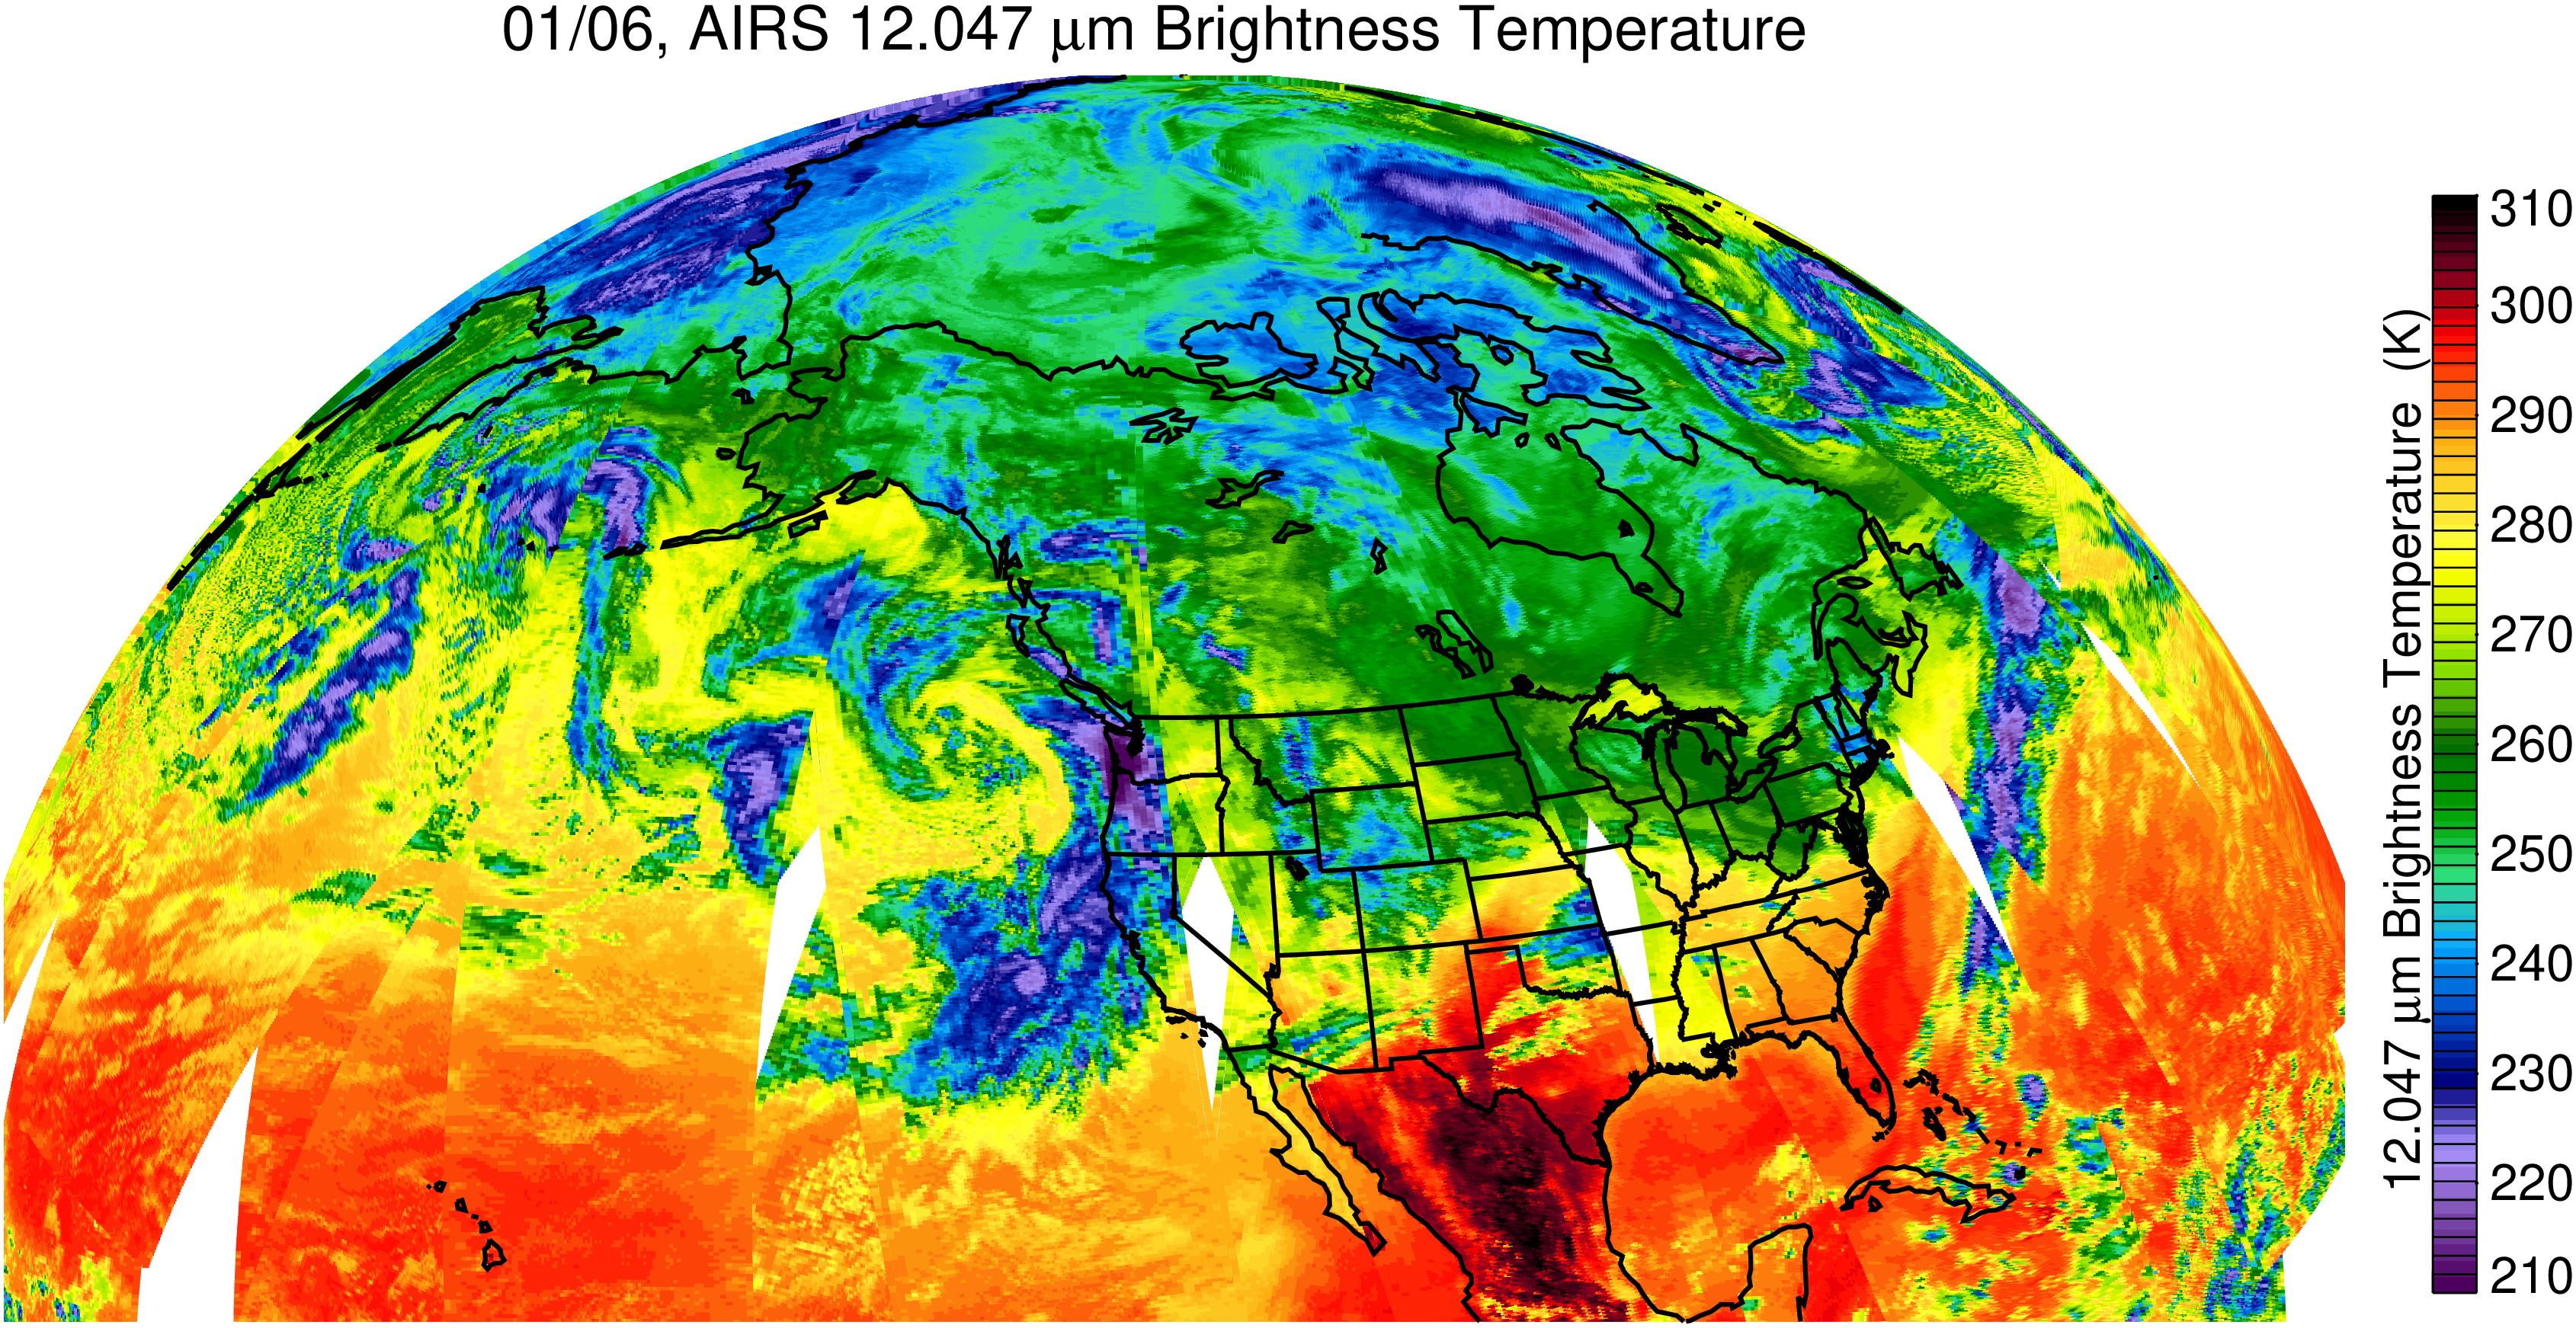
The AIRS instrument onboard NASA's Aqua satellite passes over the Earth from pole to pole covering most of the globe twice a day, making overpasses in a northward and southward track, resulting in measurements during daytime at roughly 1:30 pm and nighttime around 1:30 am, local time, over most areas. In the maps shown in the animation, both the daytime and nighttime measurements have been averaged for each day. The white spaces on the maps are the only areas that don't have measurements for a given day.
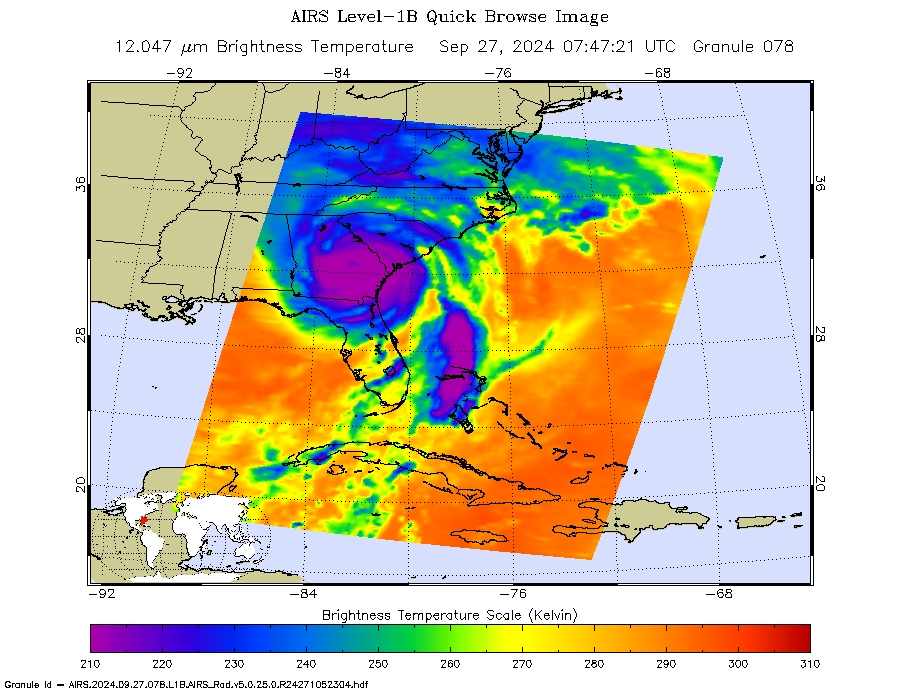
AIRS, in conjunction with the Advanced Microwave Sounding Unit (AMSU), senses emitted infrared and microwave radiation from Earth to provide a three-dimensional look at Earth's weather and climate. Working in tandem, the two instruments make simultaneous observations down to Earth's surface. With more than 2,000 channels sensing different regions of the atmosphere, the system creates a global, three-dimensional map of atmospheric temperature and humidity, cloud amounts and heights, greenhouse gas concentrations and many other atmospheric phenomena.
Launched into Earth orbit in 2002, the AIRS and AMSU instruments are managed by NASA's Jet Propulsion Laboratory in Pasadena, California, under contract to NASA. JPL is a division of the Caltech in Pasadena.
More information about AIRS can be found at: https://airs.jpl.nasa.gov