Zonally Averaged Carbon Dioxide Concentration from Earth's Mid-Troposphere at Different Latitudes, 2002 to 2013
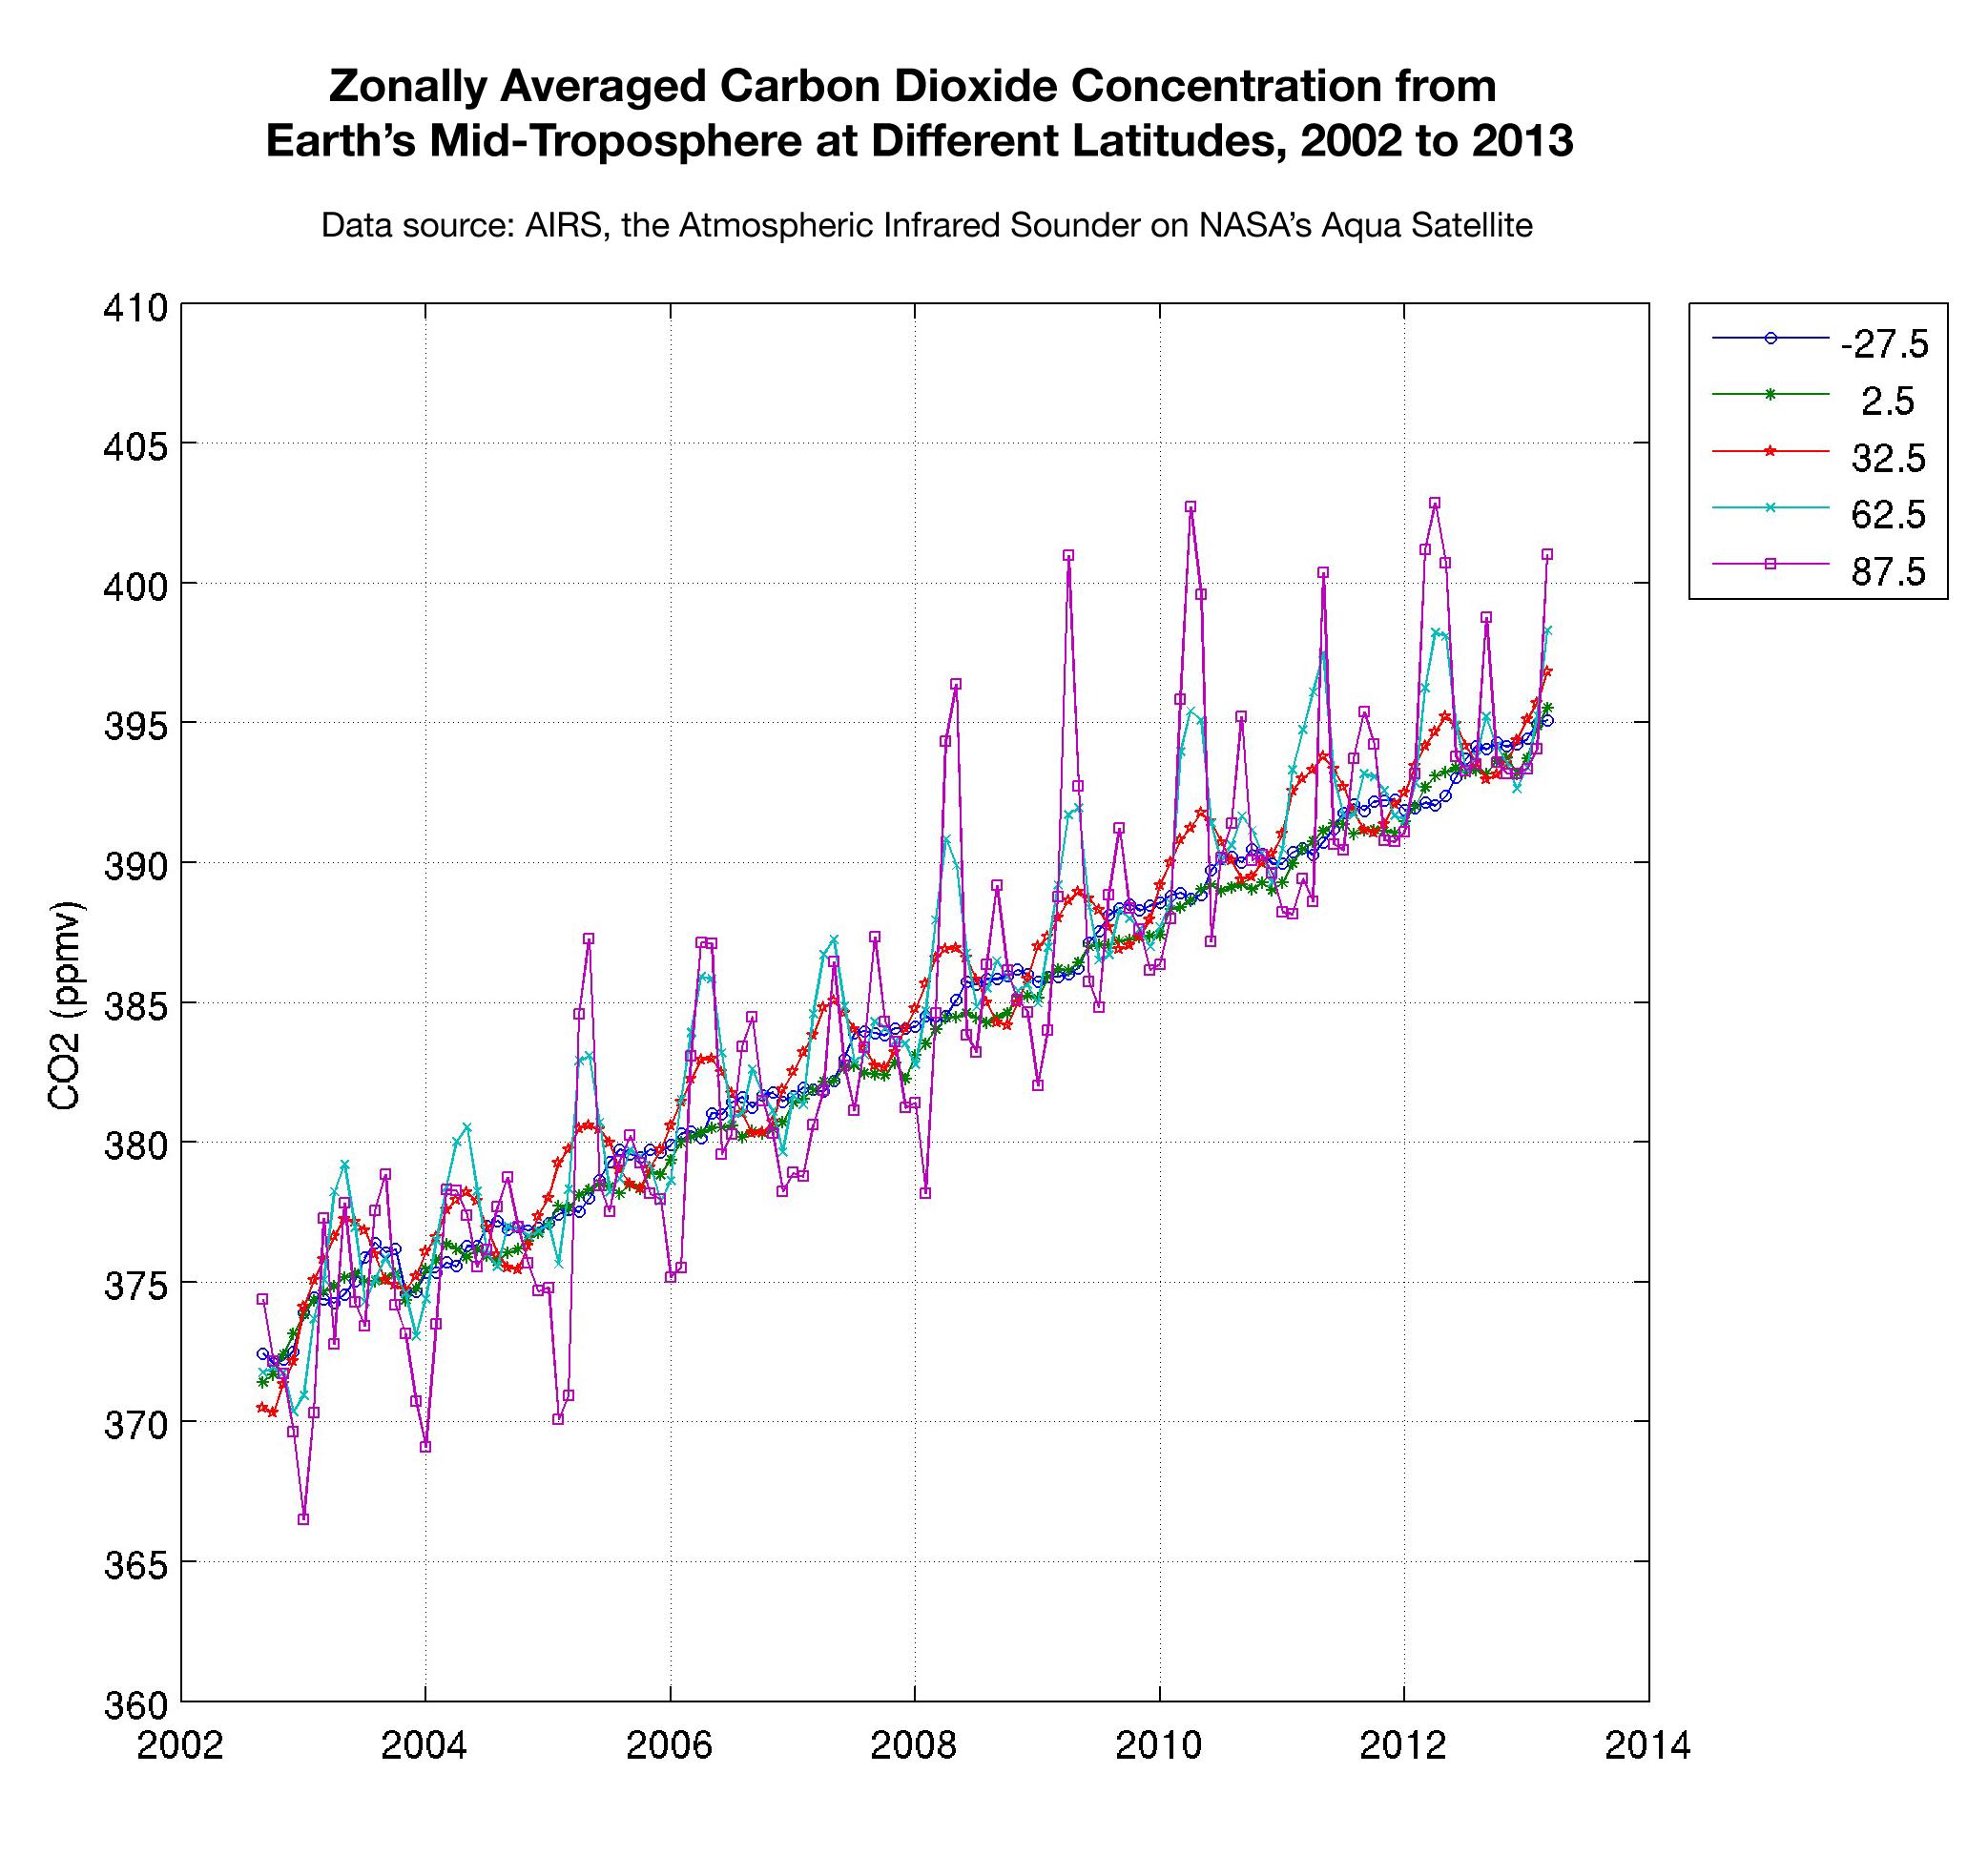
This plot shows the concentration of carbon dioxide in Earth's mid-troposphere at various latitudes as measured by the Atmospheric Infrared Sounder (AIRS) instrument on NASA's Aqua satellite. The colored lines represent different latitude bands that circle Earth, called "zones." The central latitude for each zone is given in the legend.
In the zone nearest the equator, represented by the green line, the swing in the amount of carbon dioxide is minimal since plants in the tropics remain green all year long. The seasonal intake of carbon dioxide by plants as they grow and then released when they die is not pronounced here.
In the middle latitudes at 32.5, 62.5, and -27.5 degrees latitude, we see greater swings in carbon dioxide due to the seasonal growth and die-off of plants in these regions.
Near the north pole, around 87.5 degrees latitude, we see the greatest amplitude in the seasonal cycle of carbon dioxide. But in this region the concentration of carbon dioxide is mostly driven by atmospheric circulation patterns that drive the gas from southern latitudes into the polar vortex, where the concentration of carbon dioxide is the highest on the planet.
AIRS is still in the process of validating its global carbon dioxide concentration levels, but the early results show excellent agreement with field measurements and model predictions.
