Relative humidity distributions within thin cirrus for several regions and inter-annual variations in the Indian Ocean
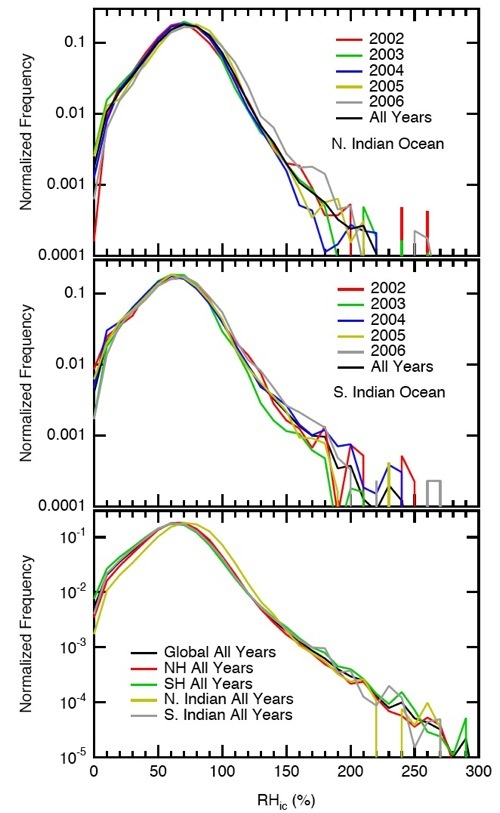
These sub-panels show differences in the characteristics of RHic histograms within thin cirrus clouds for different regions and time periods. (A) Normalized RHic distributions over the N. Indian Ocean and partitioned by year (2002-2006). (B) same as (A) except for the S. Indian Ocean. (C) Normalized RHic distributions for the tropical ocean average (±20 latitude) and for four sub-regions: the NH, SH, and N. and S. Indian Oceans. These histograms show that the variability from year to year is somewhat higher in the N. Indian Ocean versus the S. Indian Ocean, even though the total counts in the histograms are very similar. Furthermore, they also show that the North Indian Ocean tends to have 5-10% higher RHic compared to other regions. Whether this is caused by anthropogenic activity (e.g., aerosols) or controlled by the dynamics of the South Asian monsoon, or another cause is yet to be determined.
Citation
Kahn, B. H., Liang, C. K., Eldering, A., Gettelman, A., Yue, Q., and Liou, K. N.: Tropical thin cirrus and
relative humidity observed by the Atmospheric Infrared Sounder, Atmos. Chem. Phys., 8, 1501-1518, 2008.
