Calibration Products
The AIRS calibration team provides two calibrated products, AIRS L1B and AIRS L1C. These data products are then used to create higher level data products.

The calibration data sets are found at the GES DISC:
- AIRS L1B v5 Infrared
- AIRS L1B v5 Visible/Near Infrared
- AIRS L1B v5 AMSU
- AIRS L1B v5 HSB
- AIRS L1C v6.7
- AIRS CalSub v2 Summary & AIRS CalSub v2 Random Full Spectra
Calibration Bibliography
An extensive bibliography of AIRS calibration papers is available.
Bibliography of hardware and calibration papers
Input Data Files Used for Calibration
Calibration of AIRS data depends on a small collection of input data files which describe the instrument performance. These files are provided here.
Spectral Response Functions
The Spectral Response Functions (SRFs) describe the wavelength at which each AIRS channel responds. Dr. Larrabee Strow at the University of Maryland Baltimore County created these SRF data sets under contract to the NASA AIRS Project.
The L1B and L1C data products have separate SRF data sets, since the L1C channels are moved onto a regularly-spaced grid. The SRFs of the 2378 L1B channels are based on the analysis of AIRS pre-flight data measured with a Fourier Transform Spectrometer (FTS), as described in the Strow et al. 2003 IEEE special issue paper cited below.
The L1C product uses 2,645 channels. L1C was created circa 2012 to produce a more uniform product. About 2,350 channels are copied from L1B, including their SRFs. The other channels are based on the grating model, which is extended to eliminate the gaps between detector modules. L1C uses Principal Component (PC) reconstruction to fill the gaps between the detector modules. The L1C SRFs for the "fill" channels are thus based on a model.
The data files and descriptions are found at:
- Most recent L1B SRF table (srftables_051118v4.hdf)
- Archived description of L1B SRF file format (original external link)
- Most recent L1C SRF table (airs_l1c_srfs.nc)
- Archived description of L1C SRF file format (original external link)
- SRF Archive (has older L1B SRF tables)
References:
Strow, Larrabee L., et al. "Prelaunch spectral calibration of the Atmospheric Infrared Sounder (AIRS)." IEEE transactions on geoscience and remote sensing 41.2 (2003): 274-286. DOI:10.1109/TGRS.2002.808245
Gaiser, Steven L., et al. "In-flight spectral calibration of the atmospheric infrared sounder." IEEE Transactions on Geoscience and Remote Sensing 41.2 (2003): 287-297. DOI:10.1109/TGRS.2003.809708
Strow, L. L., et al. "Validation of the Atmospheric Infrared Sounder radiative transfer algorithm." Journal of Geophysical Research: Atmospheres 111.D9 (2006). DOI:10.1029/2005JD006146
Point Spread Functions
Each individual AIRS sounding that does not measure a single ray through the atmosphere, but a bundle of rays. At any place in the atmosphere or on the ground, this bundle of rays appears as a round patch, smeared by the side-to-side scanning and motion of the Aura spacecraft. These patches are not perfectly uniform. The point spread functions (PSFs) model this smeared patch. The PSFs are also known as "tophats," since the ideal shape resembles a flat-topped cylinder when plotted in 3D.

The PSF data files are available on request.
References:
Elliott, Denis A., Thomas S. Pagano, and H. H. Aumann. "The impact of the AIRS spatial response on channel-to-channel and multi-instrument data analyses." Earth Observing Systems XI 6296 (2006): 171-179. DOI:10.1117/12.679542
Pagano, Thomas S., et al. "Improving AIRS radiance spectra in high contrast scenes using MODIS." Earth Observing Systems XX. Vol. 9607. SPIE, 2015. DOI:10.1117/12.2188311
Channel Properties Files
The channel properties and calibration properties files contain the current and past history of the instrument performance parameters needed for calibration. These files are periodically updated every few years and uploaded to the GES DISC. The file formats are human-readable text files.
Files:
- zip file containing all AIRS calibration properties files
- zip file containing all AIRS channel properties files
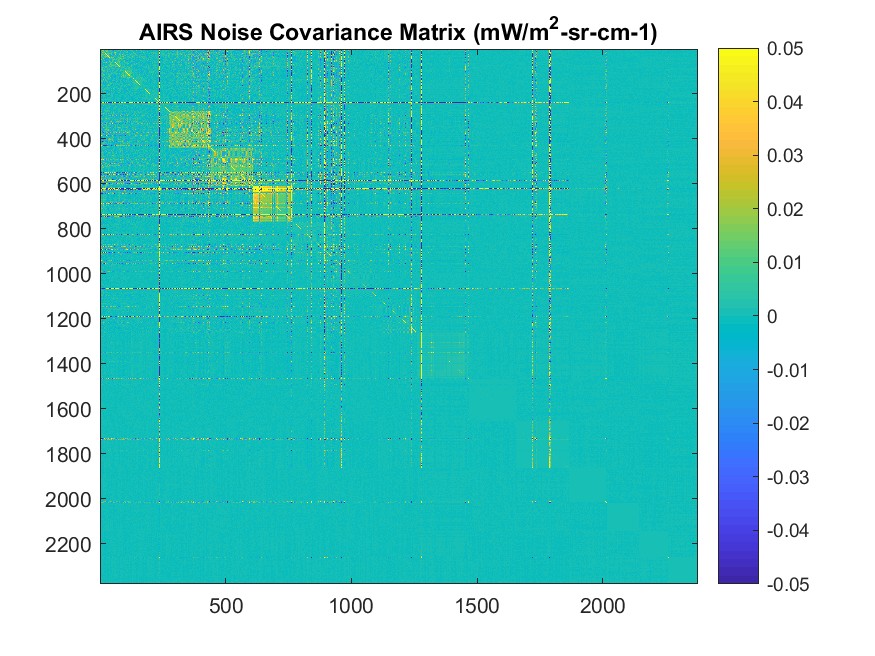
Noise Covariance Matrix
The noise covariance matrix contains information on the relationship between the noise performance between pairs of spectrometer channels. In practice, only pairs of channels from the same module have meaningful correlation.
The noise covariance files are available on request.
.jpeg?content_type=image%2Fwebp&disposition=inline)
%20at%20250%20K.jpeg?content_type=image%2Fwebp&disposition=inline)
%20at%20250%20K.jpeg?content_type=image%2Fwebp&disposition=inline)
