The visualizations and images below show several quantities AIRS has observed over its 20 year lifetime. Most of these quantities have a common trait: the effects over the past two decades of human activities are easily seen in the AIRS observations. Some of these changes are more significant than was anticipated in the early 2000s.
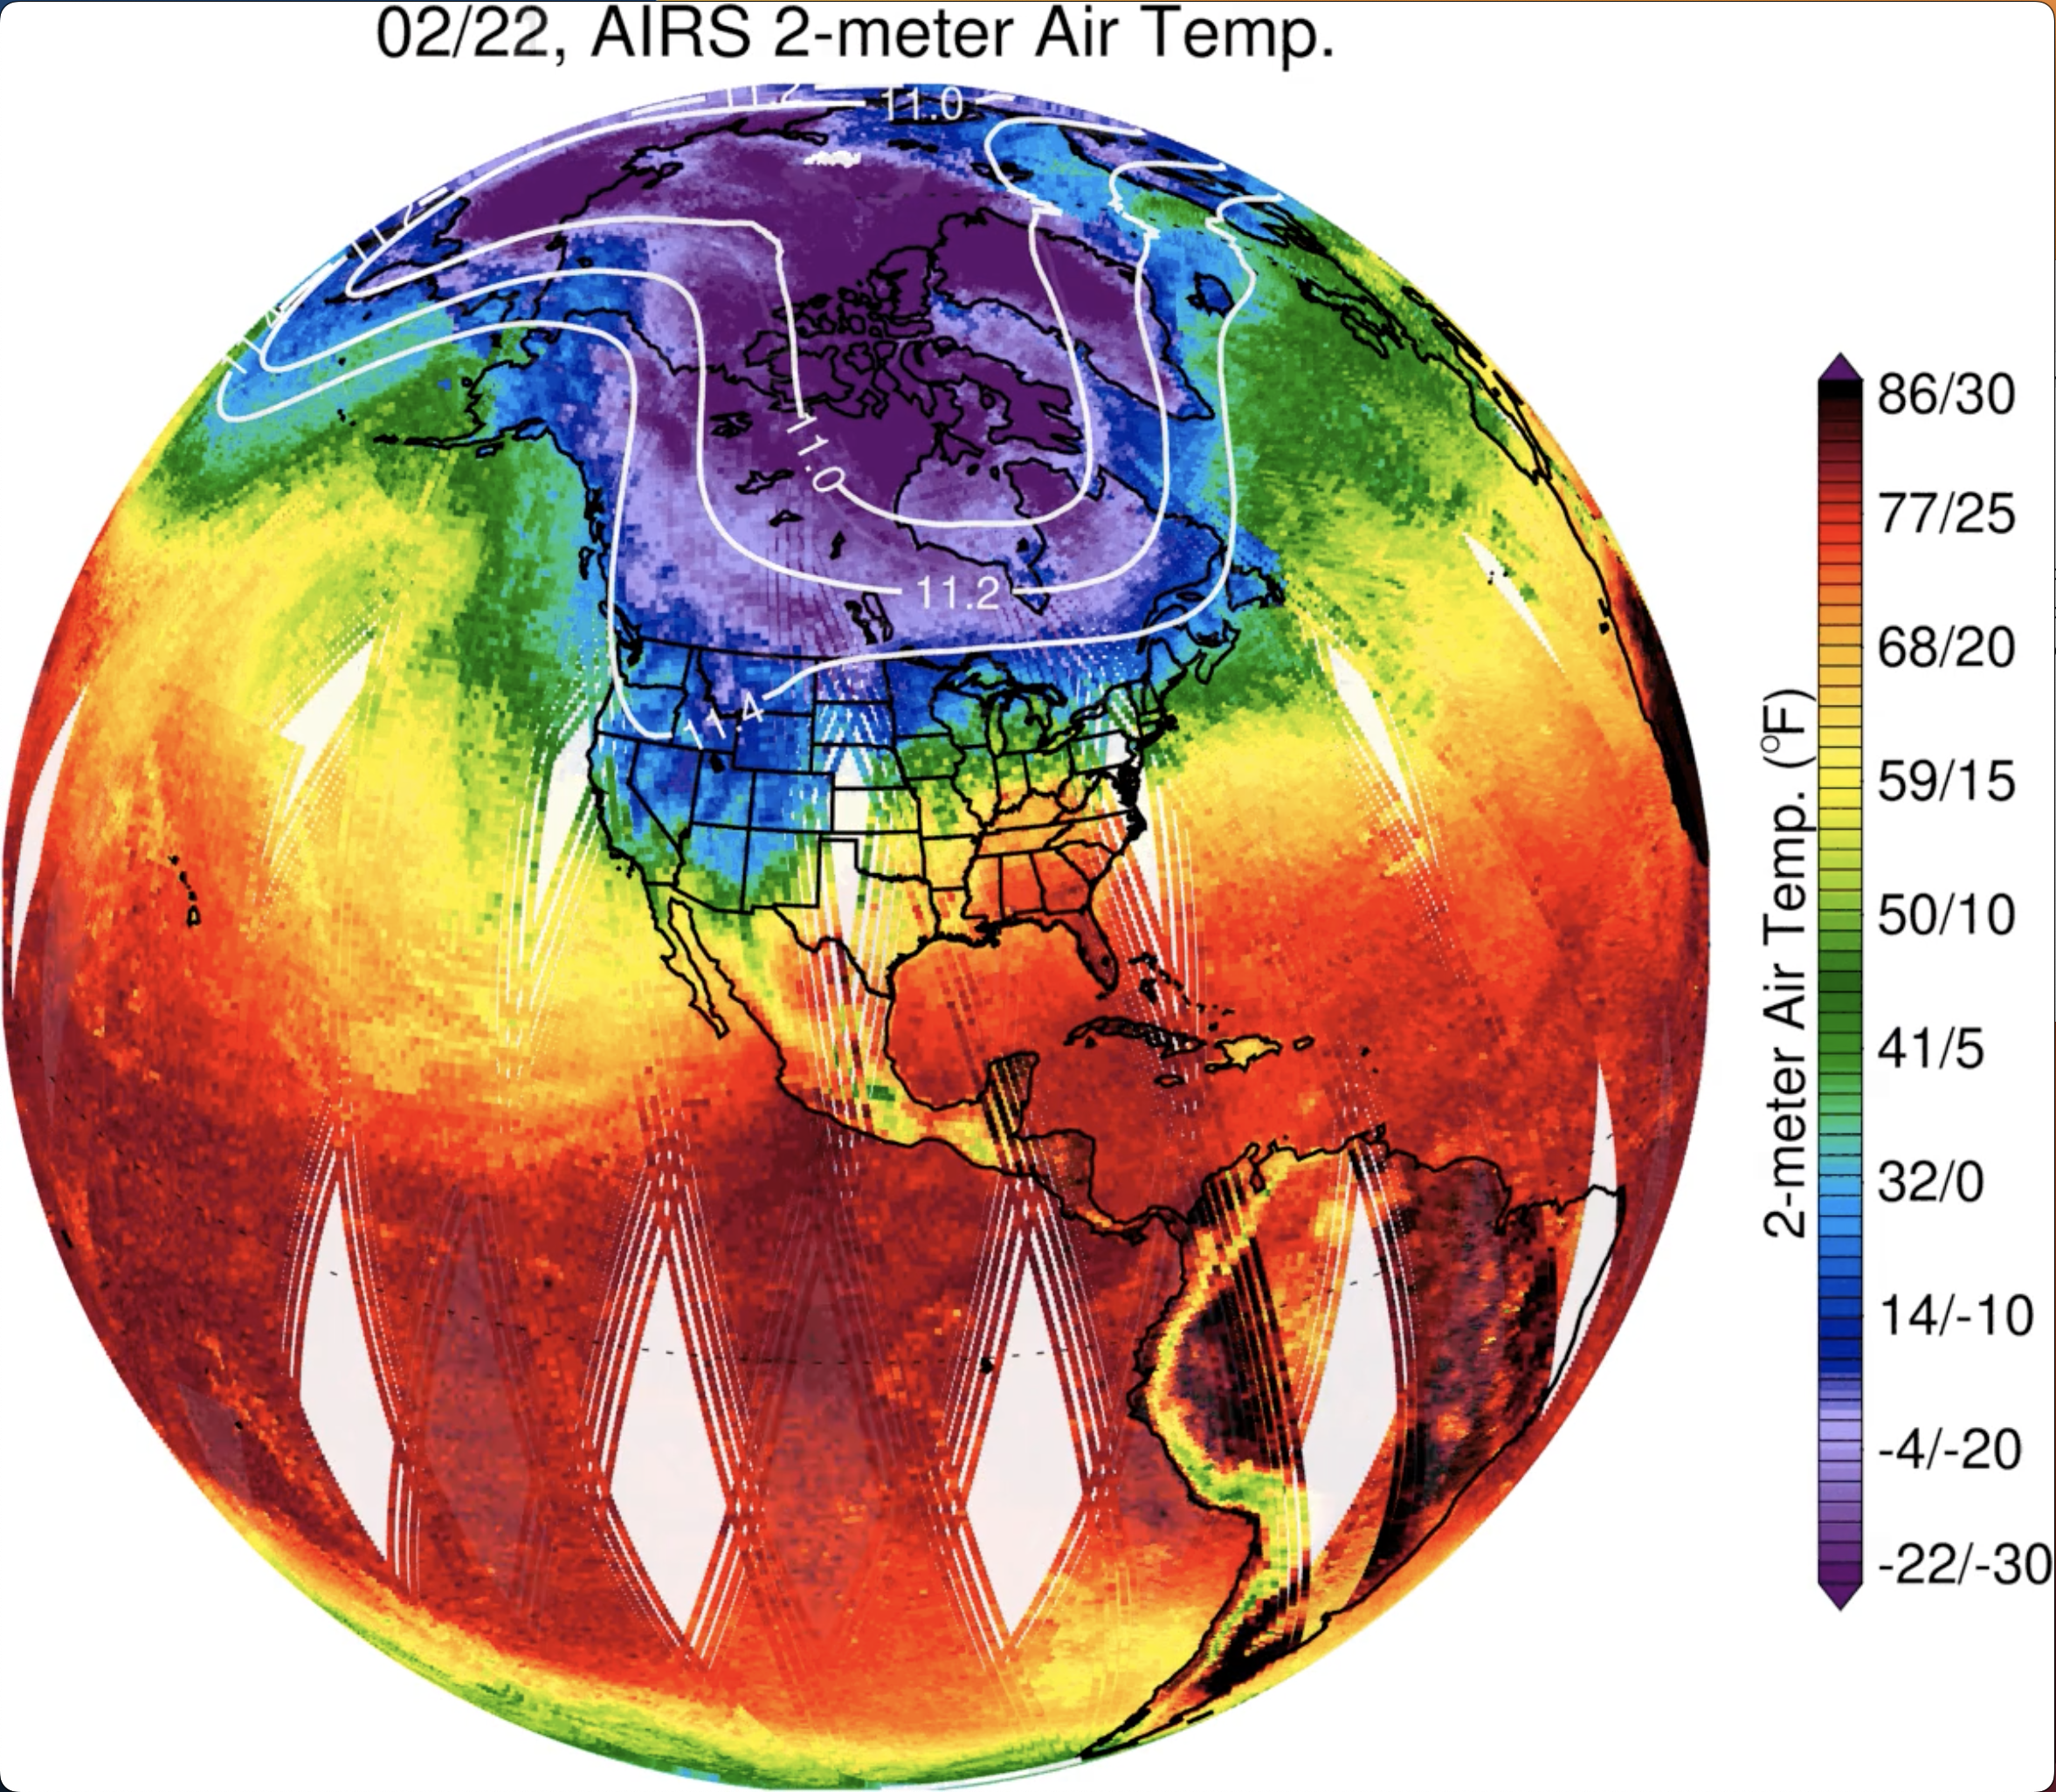
Earth’s most dramatic changes have been in the Arctic. While the planet has warmed in most places, the warming over the Artic has been unexpectedly large. This warming can be seen in the animation below, or in the interactive globes shown here. (Not every location, even in the Arctic, is warming. This can be seen over the ocean around southern Greenland, where cold, deep ocean water comes to the surface. However, this relative small cooling area is overwhelmed by significant warming elsewhere.) Arctic warming can be especially pronounced when the polar vortex moves over the continents. The resulting cold temperatures draw media attention in populated areas, and are sometimes misinterpreted as evidence that the earth is not warming. An often untold part of the polar vortex story is the remarkable Artic warming during cold air outbreaks at lower latitudes, as discussed here.
The AIRS data set, with is global coverage, has been helpful in revealing other local changes in climate as the planet as a whole warms. One such example of change is an increase in heat waves. The video below shows a record-setting ‘heat dome’ over the Pacific Northwest in June, 2021.
Warmer air holds more moisture, and warming has been accomplished by increases in water vapor. The increase in water vapor AIRS has observed is illustrated in the video below (see also the interactive globes shown here). As with warming, the increase in water vapor is greatest in the Artic. Water vapor is a strong greenhouse gas, so its growth leads to additional warming, amplifying the effects of other greenhouse gases like carbon dioxide.
Carbon dioxide has steadily increased over the past twenty years due to human activities, especially the burning of fossil fuels, as seen in the visualization below. Carbon dioxide levels in the atmosphere are also determined by natural sources and sinks. The levels of carbon dioxide show a seasonal cycle, with a decrease in spring and summer due to uptake by plants during the growing season and a build-up during the winter. This cycle is strongest in the northern hemisphere, where most of the land masses are. The natural cycle is superimposed on the overall increase that is associated with burning of fossil fuels.
AIRS has also observed several other trace gases – those in small amount but whose presence is still important in climate or health.
One example is carbon monoxide. Carbon monoxide plays a role in the production of smog, via reactions with other pollutants in the presence of sunlight. The major primary sources of carbon monoxide are burning of fossil fuels and fires. The biggest enhancements in carbon monoxide seen in the global maps from AIRS (below) are associated with fires, both wildfires and deliberately set fires used to clear forests and to increase grass growth for livestock. Fire signatures in carbon monoxide are most pronounced in the tropics in southern hemisphere spring and northern hemisphere summer. While the incidence of large burning events has increased over the length of the AIRS record, there has been a decreasing trend in carbon monoxide overall, due to the atmospheric impact of air quality management policies in developed countries over this time period. A secondary source of carbon monoxide is the oxidation of biogenic compounds emitted by plants. Due to the decreases in anthropogenic carbon monoxide, in the US in summer, the biogenic source is now larger than the anthropogenic source.
Ammonia gas is produced by livestock (giving stockyards a distinctive aroma), by fires, and as a byproduct of agriculture fertilizers. The amount of ammonia in the atmosphere also depends upon the amount of small aerosol particles, produced mainly by burning. The signature of all these human activities is seen below with ammonia.

Methane is a gas produced by livestock, by rice paddies, and by wildfires. The growth rate of methane over the past 20 years, as seen below, is a topic of continuing study because the exact cause of year-to-year variations in this growth rate is not fully understood. Methane is a potent greenhouse gas, second only to carbon dioxide in driving global warming.
Ozone is an important trace gas, with most residing in the stratosphere, 10 or more miles above the surface. Because ozone absorbs dangerous ultraviolet sunlight, it is critical for life on earth. The destruction of ozone by fluorocarbon gases within the Antarctic ‘ozone hole’ was discovered in the 1980s, but the ozone hole persists to this day, appearing every year in the southern hemisphere spring (around October). The video below shows the development of one of the largest and longest lasting ozone holes on record in 2020, and the time evolution of the ozone hole for other years of the AIRS mission can be seen here.
Sulfur dioxide is another gas monitored by AIRS. While sulfur dioxide is produced in some coal-fired power plants, its most dramatic source is volcanoes. AIRS has observed elevated sulfur dioxide amounts from several volcanic eruptions (see the example below). These plumes of volcanic gases have been seen by AIRS to circle the planet for days or even weeks before slowly dissipating (see here for example). Particularly large volcanic eruptions can cool the atmosphere for years as sulfur dioxide turns to sulfuric acid in the stratosphere and forms clouds of droplets. Those clouds are highly reflective, effectively reducing the strength of the sun by reflecting some sunlight back to space. While AIRS can detect volcanic sulfur dioxide, no volcanoes have significantly cooled the earth in the twenty years of AIRS operations.

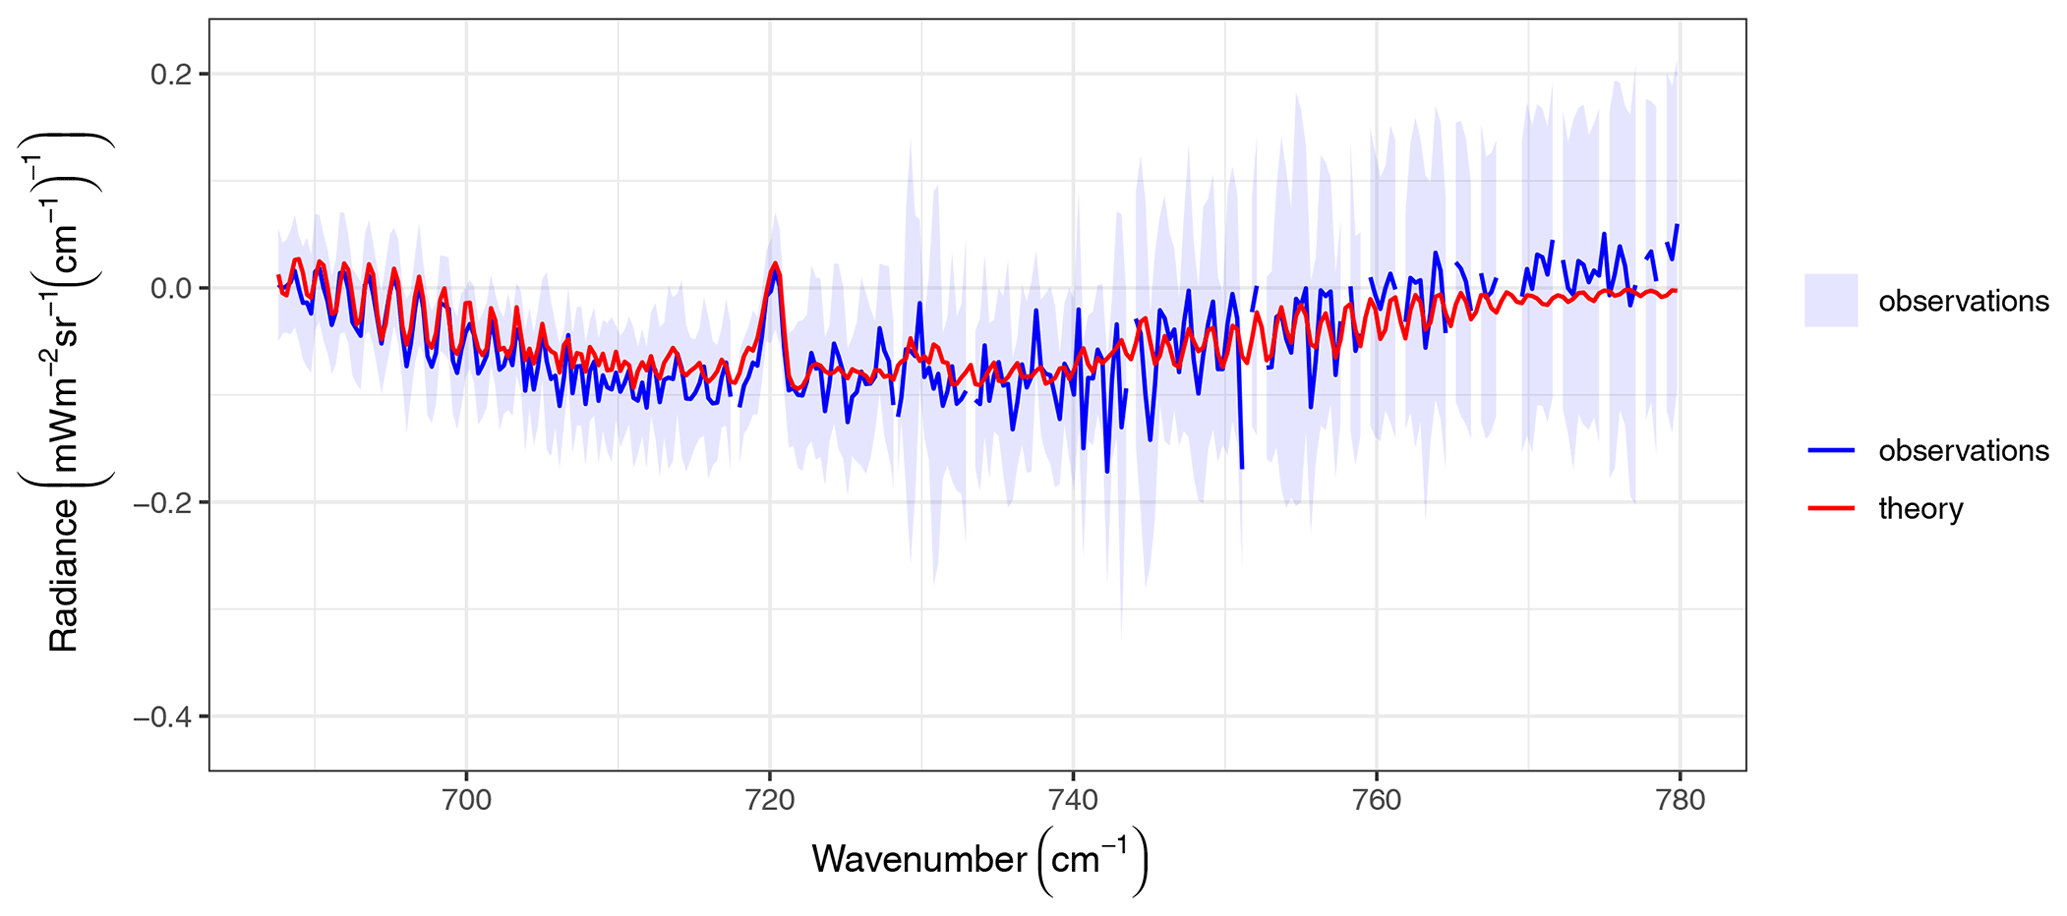
The high precision and remarkable stability of the AIRS instrument over 20 years has given us a window into some of Earth’s most important atmospheric trends and processes.