Ozone
Key Questions
CLIMCAPS retrieves profiles of ozone (O3) layer densities as molecules per cm2 [molec/cm2] on the standard 100 vertical pressure layers at each retrieval footprint, also known as ‘field of regard’. CLIMCAPS retrieves O3 from a subset of hyperspectral infrared (IR) channels centered on the ~1030 cm−1 (~9.7 µm) O3 absorption line.
How can I access CLIMCAPS O3 retrievals?
CLIMCAPS O3 retrievals are part of the main Level 2 product file that is generated and archived by the NASA Goddard Earth Sciences Data and Information Services Center (GES DISC).
Can I use CLIMCAPS products to study stratospheric O3?
Yes. CrIS and AIRS are passive instruments that make IR measurements of emitted radiance [mW/m2/steradian/cm−1] at the top of atmosphere. This means their measurements are sensitive to the atmospheric state from the ‘top down’ with higher sensitivity to stratospheric emissions. For gases such as H2O, CO and CH4 this holds no advantage because their stratospheric concentrations are negligible. Ozone, on the other hand, has stratospheric concentrations that far exceeds those from the troposphere (Figure 6) so its IR spectral signature is distinct and strong (Figure 1b; Figure 2). Stratospheric emission signals additionally benefit from low interference due to clouds, surface properties and pollutant gases. CLIMCAPS stratospheric O3 retrievals from CrIS and AIRS measurements are, therefore, robust and can support stratospheric O3 science and applications such as Gray (2019), Wargan et al. (2018) and Witze (2020).
Can I use CLIMCAPS products to study tropospheric O3?
Sometimes. Unlike CO2 that has different spectral signatures for stratospheric and tropospheric CO2, O3 from different parts of the atmosphere generate spectral signatures that overlap in the ~1030 cm−1 region (Figure 2). Retrieving tropospheric O3 (weak signal) means treating stratospheric O3 (strong signal) as spectral interference. In the methane chapter, we discussed the challenge in retrieving weak signals (CH4) from channels with strong interference (H2O). CLIMCAPS can retrieve tropospheric O3 with a degree of certainty when conditions allow, such as low stratospheric O3, high temperature lapse rates, high surface temperature, low tropospheric H2O vapor, absence of clouds and/or homogeneous surface emissivity. We diagnosed CLIMCAPS observing ability for tropospheric O3 in Section 3.2 of Smith and Barnet (2020).
A number of diagnostic metrics in the CLIMCAPS product file support the inclusion of CLIMCAPS O3 in data inter-comparisons and global evaluations such as Gaudel et al. (2018) and Cooper et al., (2014). We envisage that CLIMCAPS O3 could also support severe weather research by characterizing stratospheric O3 intrusion events (Berndt and Folmer, 2018; Dreessen, 2019; Langford et al., 2018). We advise against using CLIMCAPS O3 in air quality monitoring since lower tropospheric information content is too low.
1. Overview
1.1 CLIMCAPS algorithm flow with respect to O3
It is difficult to decompose (or invert) the information content of spectral measurements into distinct atmospheric variables suitable for science applications and climate studies. Once achieved for a single measurement under specific conditions, it is perhaps even more challenging to then replicate the same degree of robustness and quality in spectral inversions anywhere on the globe, day and night, Summer through Spring, year in, year out. Space-based IR and microwave (MW) measurements have highly correlated information about multiple atmospheric variables in each channel with signal-to-noise ratios changing from scene to scene. We demonstrate this for CO2 and CH4 elsewhere and for O3 in Figures 1 and Figure 2 below.
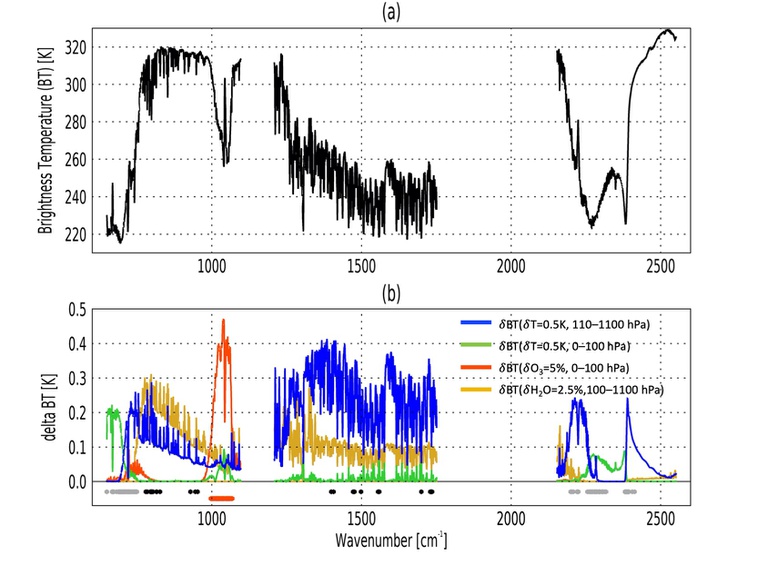
Figure 1: (a) Simulated CrIS spectra for the longwave (648.75–1096.25 cm−1), mid-wave (1208.75–1751.25 cm−1) and shortwave (2153.75–2551.25 cm−1) bands using SARTA (Strow et al., 2003) with atmospheric state defined by the first CLIMCAPS V2 retrieval (scanline=1, footprint=1) of granule 104 on 1 April 2018 from an ascending orbit (13h30 local overpass time). SARTA simulates CrIS spectra in radiance units [mW/m2/steradian/cm−1], which we converted to brightness temperature [K] at scene temperature. (b) Absolute values of Brightness Temperature differences (dBT) to illustrate absorption features for temperature (T), ozone (O3) and water (H2O) vapor given a (blue) dT = 0.5 K perturbation in tropospheric T, 110–1100 hPa, (green) dT = 0.5 K perturbation in stratospheric T, 0–100 hPa, (red) dO3 = 5% stratospheric O3 perturbation, 0–100 hPa, and (gold) dH2O = 2.5% tropospheric H2O perturbation, 100—1100 hPa. Dots below the zero line indicate the CLIMCAPS retrieval channel sets for O3 (red) as well as the first (grey) and second (black) pass of T retrievals.
Figure 1a is the full resolution CrIS spectrum in brightness temperature (BT) units [K] that we simulated with SARTA (Strow et al., 2003) using CLIMCAPS-SNPP retrievals (temperature, H2O vapor, trace gases, surface temperature and cloud parameters) as state variables, and specifically those from scanline 1, footprint 1, ascending (daytime) granule 101 on 1 April 2018. Figure 1b depicts the spectral signatures for temperature, O3 and H2O in the long-, mid- and shortwave IR bands as the absolute value of the kernel functions, \( K \), given by the change in BT, \( y \), for a change in state variable, \( x \), as:
Eq. 1 \( K = | \frac{\delta y}{\delta x} | = | F(x)-F(x-p) | \)
where \(F\) is the SARTA forward model with which we calculate a simulated CrIS radiance spectrum [mW/m2/steradian/cm−1] and convert to BT [K] at scene temperature, x is the state variable perturbed by the factor p. In Figure 1b, we perturbed tropospheric H2O by 2.5%, thus , stratospheric and tropospheric temperature respectively by 0.5 K, thus , and stratospheric O3 by 5%, thus . Kernels are typically 2-D matrices with dimensions [m x n], where m is the number of spectral channels and n the number of pressure layers. Our brute force kernels in Figure 1b have n = 1 because we perturb the target variable along a single broad layer for the sake of simplicity and illustration. In retrieval systems, 1 < n ≤ 100 to maximize information content and vertical resolution, given system constraints.
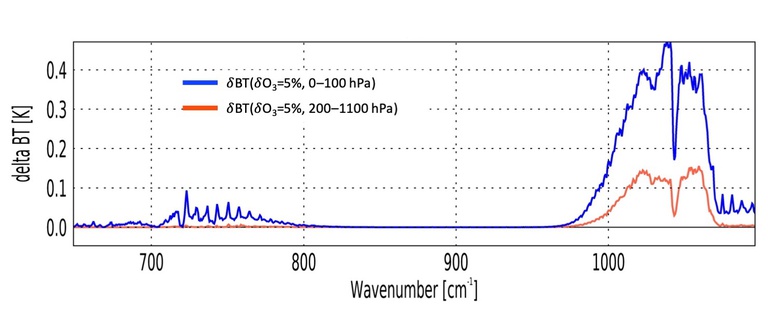
Of note in Figure 1b is the strength of the spectral kernel for a 2.5% perturbation in stratospheric O3 [0–100 hPa] in the ~1030 cm−1 wavenumber region. It is from this region that we selected the set of channels for CLIMCAPS O3 retrievals. A series of red dots below the zero line in Figure 1b indicates the spectral range of this channel set and we see that while these channels are dominated by stratospheric O3 emission (red), they have interference signals from tropospheric H2O vapor (gold) and temperature (blue) as well as stratospheric temperature (green). Additionally, the stratospheric and tropospheric spectral kernels for a 5% change in O3 overlap in the ~1030 cm−1 region as depicted in Figure 2 below, which complicates their separation during retrieval.
Figure 2: Same as Figure 1b but for O3 kernels with 5% perturbation in the (blue) stratosphere [0–100 hPa] and (red) troposphere [200–1100 hPa].
There is a second stratospheric O3 emission feature in the 700–800 cm−1 longwave range as seen in Figure 1b and Figure 2. We do not use any channels from this region in the O3 retrieval because it is buried within the CO2 absorption region; however, knowledge of scene-dependent O3 contributes to lower tropospheric retrievals of temperature. Note how the channel set used in CLIMCAPS temperature retrievals (grey + black dots below the zero line in Figure 1b), samples this stratospheric O3 spectral feature specifically, which means that the CLIMCAPS temperature retrievals depend on knowledge of stratospheric O3 to correctly account for variability in these channels at a retrieval scene. We elaborate on this in the discussion of Figure 3 below.
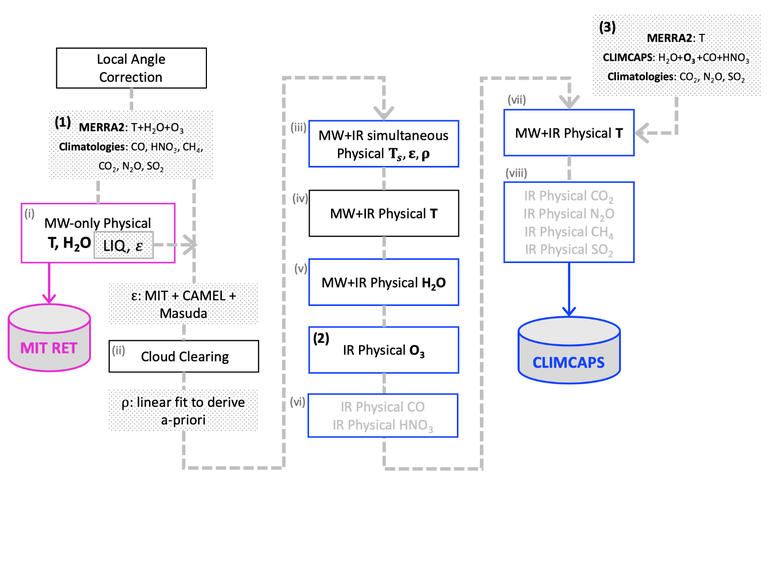
We adopted a sequential retrieval approach in CLIMCAPS (Smith and Barnet, 2019, 2020) to stabilize the retrieval of nine atmospheric profile variables from a single set of collocated MW (AMSU or ATMS) and IR (AIRS or CrIS) measurements. We combine this approach with a rigorous error quantification and propagation to enable robust retrievals across a wide range of conditions of the global atmosphere. In Figure 3 below we outline the CLIMCAPS sequential retrieval approach with a specific focus on O3 at three steps. We show the CLIMCAPS algorithm flow in Smith and Barnet (2019, 2020) respectively.
Figure 3: Flow diagram of CLIMCAPS sequential retrieval algorithm with a focus on O3 along three steps as discussed in text below. The full algorithm flow diagram is available elsewhere and we discussed different aspects of algorithm flow in Figures 1 and 2 of (Smith and Barnet, 2019, 2020), respectively. Output from retrieval steps defines air_temp and the mol_lay subgroup in the netCDF product file. Output from the magenta step defines the mw subgroup.
Step (1) initializes the nine profile retrieval variables –temperature, H2O, O3, CO, HNO3, CH4, CO2, N2O and SO2 – as their a-priori geophysical estimates and associated error covariance matrices. This set of a-priori estimates defines the background atmospheric state for (i) the MW-only retrieval step (Rosenkranz, 2001, 2006), (ii) cloud clearing, (iii) simultaneous surface parameter retrieval and, (iv) the first MW+IR temperature retrieval using the channel set indicated by grey dots in Figure 1b.
From this step onward, the temperature a-priori is replaced with the output from step (iv) so that scene-dependent knowledge of temperature and its associated uncertainties can correctly account for variation in the trace gas channel sets going forward. At (v), CLIMCAPS performs a joint MW+IR H2O retrieval which similarly replaces the H2O a-priori going forward. Now that temperature and H2O are known, (2) O3 is retrieved so that tropospheric temperature and H2O interference in the O3 channel set can be accounted for (Figure 1b).
Then follows the retrieval of (vi) CO and HNO3 in that order. At (vii) T is retrieved a second time using additional spectral channels (grey + black dots in Figure 1b) because scene-dependent knowledge of H2O, O3, CO and HNO3 now enables a more accurate definition of the background atmospheric state and interference from these gas species in the temperature channel subset.
Note that the a-priori and its associated error covariance matrix is exactly the same for the first and second temperature retrieval steps. The difference is that the H2O, O3, CO and HNO3 a-priori profiles are replaced by the CLIMCAPS retrievals and the temperature measurement error covariance matrix is updated with estimates of scene-dependent uncertainty as described in (Smith and Barnet, 2019) The last step (viii) retrieves CO2, N2O, CH4 and SO2 in that order.
We wish to draw your attention to three areas where O3 contributes to the CLIMCAPS system specifically. At (1) CLIMCAPS initializes MERRA2 as the O3 a-priori with our empirical covariance matrix (Figure 8) as its error estimate. This definition of O3 contributes to a number of steps as described above. At (2) CLIMCAPS retrieves O3 using the ~1030cm-1 channel subset (Figure 1b). For each retrieved O3 profile, CLIMCAPS calculates a Bayesian a-posteriori error estimate that updates the a-priori error estimate with knowledge about scene-dependent uncertainty and instrument noise. At (3), the O3 retrieval is now used as background state variable in the retrieval of temperature, while the O3 a-posteriori error covariance matrix is added to the temperature measurement error covariance as described in Figure 1 of (Smith and Barnet, 2019). Not only does this second temperature retrieval benefit from scene-dependent knowledge of stratospheric O3, it also benefits from a more accurate estimate of uncertainty about the O3 state at the target scene.
1.2 O3 information content and retrievals
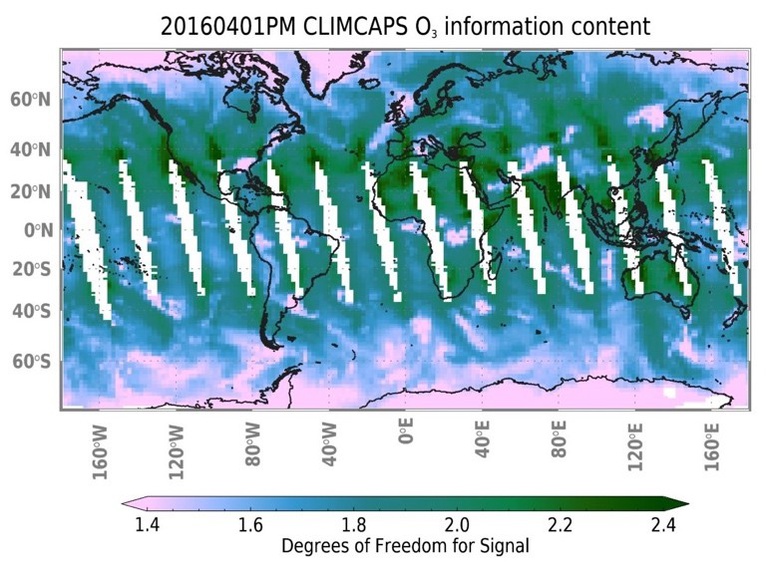
As described in other chapters, we can calculate the total column information content for CLIMCAPS O3 retrievals as the ‘degrees of freedom’ (DOF). Figure 4 depicts O3 DOF from full spectral resolution CLIMCAPS-SNPP ascending orbits on 1 April 2016. The O3 DOF from CLIMCAPS-Aqua and CLIMCAPS-NOAA20 are similar (not shown) and is in general around 2.0 for most of the globe. This means CLIMCAPS has sensitivity to O3 at two distinct layers in the vertical atmosphere. When we plot the CLIMCAPS O3 averaging kernels (Figure 5) we see that CLIMCAPS information content for O3 has peaks in the stratosphere and upper troposphere.
Figure 4: CLIMCAPS-SNPP degrees of freedom (DOF) for O3 from full-spectral resolution CrIS at every retrieval scene from ascending orbits (13h30 local overpass time) on 1 April 2016. DOF is an information content metric and quantifies how many pieces of information (or distinct vertical layers) CLIMCAPS can retrieve about O3 at every scene. For most of the globe, CLIMCAPS has O3 1.5 < DOF < 2.5. We used the netCDF field o3_dof and did not apply any quality filtering since DOF is not affected by retrieval outcome.
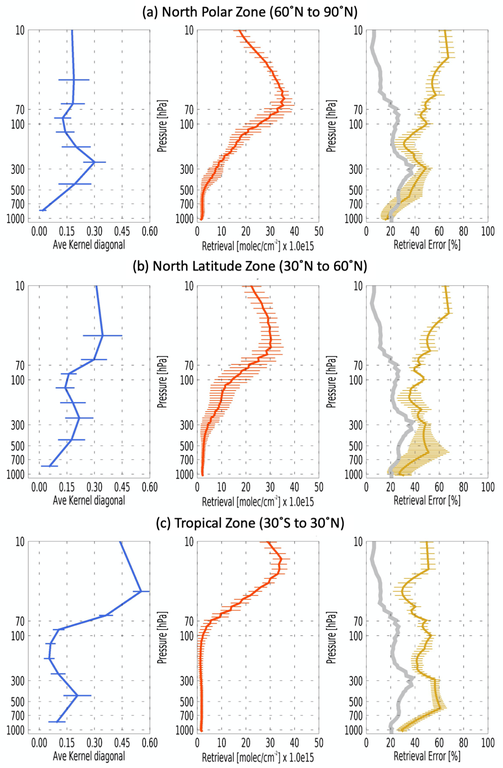
Figure 5 depicts mean profiles (with standard deviation error bars) of (i) sensitivity to the true state given by the averaging kernel matrix diagonal, (ii) layer density retrievals and (iii) a-posteriori error for three latitudinal zones, (a) North Polar (> 60˚North), (b) Mid-Latitudes (>30˚N, <60˚N) and the Tropics (>30˚S, < 30˚N). Note how there are fewer vertical error bars on the averaging kernel profile (blue line) compared to the retrieval (orange line) and error (yellow line) profiles. This is because CLIMCAPS averaging kernels are calculated on a reduced set of pressure layers, defined by a series of overlapping trapezoids.
The retrieval error profiles (yellow) in Figures 5a/b/c represent the diagonal vector of the a-posteriori error covariance matrix (Figure 8) that CLIMCAPS generates for each retrieval variable at each field of regard. This error profile in the netCDF file (mol_lay/o3_mol_lay_err) has the same units [molec/cm2] as the retrieval profile (mol_lay/o3_mol_lay) so we could easily calculate the error as a percentage by dividing the error by the retrieval, multiplied by 100. This error does not represent the accuracy, bias, or error with respect to the true state, but instead is a representation of how much CLIMCAPS adjusted the a-priori error estimate, given system uncertainty.
For all other retrieved variables, the CLIMCAPS a-posteriori error is greater than the a-priori error (yellow versus grey profiles in right-hand panels of Figure 5). What does this mean? It means that the a-priori error covariance (Figure 8) is probably too low, or under-represents the real uncertainty in O3, and specifically in the stratosphere where we see the largest difference between these two error profiles. Alternatively, it means that we need to re-evaluate our O3 channel selection to increase the signal-to-noise in the retrieval. CLIMCAPS retrievals do benefit from this updated O3 error covariance matrix as described above.
Figure 5: A diagnosis of CLIMCAPS-SNPP O3 retrievals in (a) North polar zone [>60˚N], (b) North mid-latitude [>30˚N, <60˚N] and (c) Tropics [>30˚S, <30˚N] on 1 April 2016. Each solid line represents the mean zonal profile with error bars defined by the standard deviation at each pressure layer. [left column] CLIMCAPS O3 averaging kernel matrix diagonal vector from netCDF field ave_kern/o3_ave_kern that indicates the pressure layers at which CLIMCAPS has sensitivity to the true state of O3 in the atmosphere. [middle column] CLIMCAPS O3 mean profile retrieval from netCDF field mol_lay/o3_mol_lay [molec/cm2]. [right column] CLIMCAPS retrieval error from netCDF field mol_lay/o3_mol_lay_err [molec/cm2] represented here as percentage [mol_lay/o3_mol_lay_err]/[ mol_lay/o3_mol_lay]*100. CLIMCAPS uses an empirical a-priori error estimate, which is represented here by the thick grey line. In calculating these mean profiles, we filtered out all retrievals where mol_lay/o3_mol_lay_qc(i,j) > 1. We plot these profiles using the pressure layer array called air_pres_lay.
Users of the CLIMCAPS O3 product can readily compare retrievals with their a-priori, MERRA2, since we include the space-time collocated MERRA2 fields in the product file. We give an example of how to diagnose CLIMCAPS O3 retrievals with respect to their a-priori’s in (Smith and Barnet, 2020).
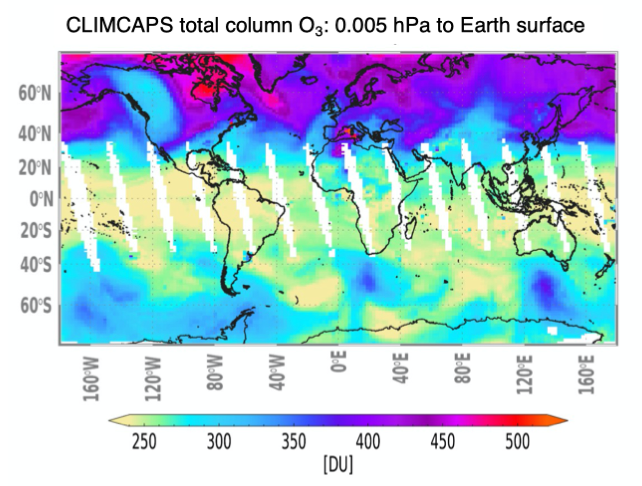
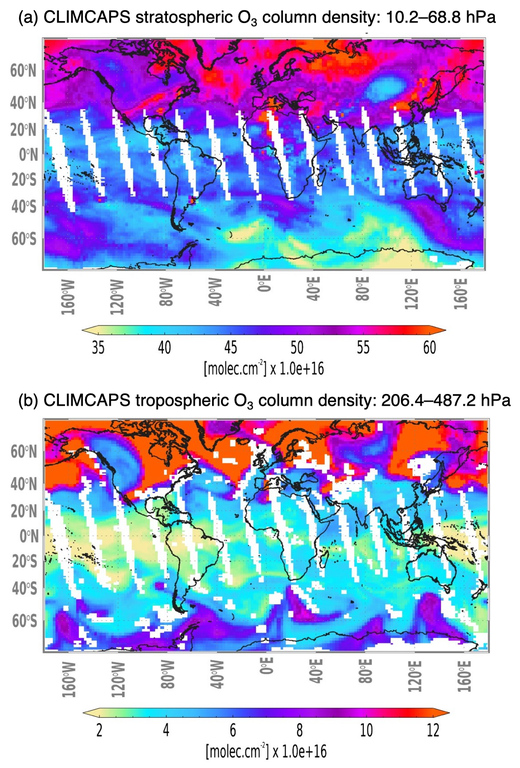
Figure 6 and Figure 7 are global maps of the CLIMCAPS O3 retrieval fields gridded and averaged to 1.5-degree equal angle grids for the ascending orbits of CrIS/ATMS on SNPP on 1 April 2016. Total column O3 [DU] (Figure 6) has contributions from stratospheric O3 (Figure 7a) and tropospheric O3 (Figure 7b).
Figure 6: Global maps of daytime (ascending orbit; 13h30 local overpass time) CLIMCAPS-SNPP total column O3 in Dobson Units [DU]. We generated this map using netCDF field o3_tot [kg/m2] multiplied by 4.67e+04 to convert to DU. We filtered out all values where o3_tot_qc > 1.
We made Figure 6 using the netCDF field o3_tot and filtered out all values where o3_tot_qc >1. For the map in Figure7a, we integrated all values in mol_lay/o3_mol_lay [molec/cm2] between vertical layers air_pres_lay(21)/100.0 = 10.26 hPa and air_pres_lay(39)/100.0 = 68.8 hPa. Figure 7b has mol_lay/o3_mol_lay [molec/cm2] integrated across air_pres_lay(56)/100.0 = 206.4 hPa and air_pres_lay(75)/100.0 = 487.2 hPa. We integrated and averaged all values where the corresponding mol_lay/o3_mol_lay_qc > 1. Note that fewer retrievals are filtered out in the stratosphere (Figure 7a) due, predominantly, to the absence of clouds and H2O.
Figure 7: Same as Figure 6 but for (a) stratospheric layer from 10.2–68.8 hPa, and (b) upper tropospheric layer from 2016.4–487.2 hPa. For this plot, we used O3 from the netCDF field mol_lay/o3_mol_lay on 100 pressure layers (air_press_lay) and summed all values for (a) across layers 4 to 39 and for (b) across layers 56 to 75. We removed all retrievals where mol_lay/o3_mol_lay_qc > 1.
1.3 O3 a-priori and error estimate
CLIMCAPS employs the Modern-Era Retrospective analysis for Research and Applications Version 2 (MERRA2; Gelaro et al., 2017; GMAO, 2015; Wargan et al., 2017) as O3 retrieval a-priori. CLIMCAPS converts MERRA2 from it native 72 pressure levels to column density [molec/cm2] on the standard 100 retrieval layers (air_pres_lay). CLIMCAPS then interpolates these MERRA2 profiles spatially and temporally to match the cloud-cleared CrIS/AIRS measurements. We describe the benefits of employing MERRA2 as a-priori in Section 2.2.3 of Smith and Barnet (2019) and compare it against the a-priori approach taken in AIRS V5 and V6.
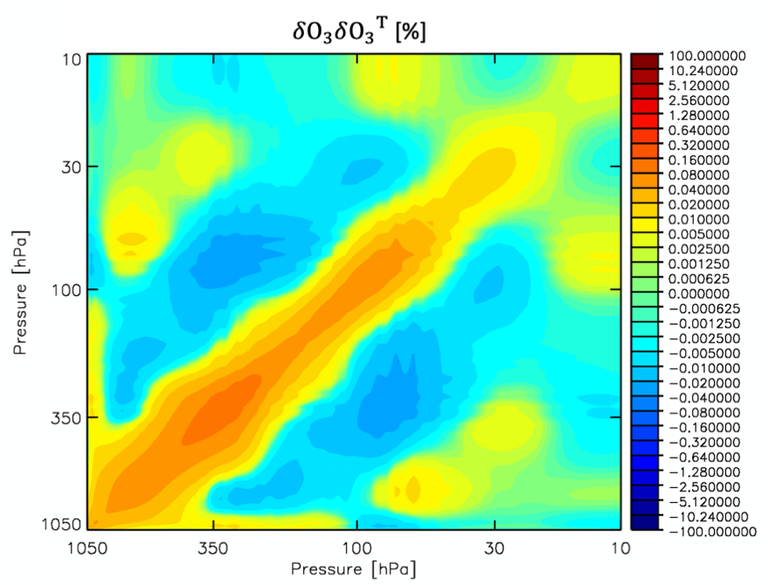
We derived the a-priori error covariance matrix δO3 δO3T (Figure 7) empirically from an ensemble of co-located MERRA2 and ECMWF O3 profiles as percent difference: (ECMWF – MERRA2)/ECMWF. This ensemble was made up of 233,135 profiles from four global days in 2015, 1 January, 1 April, 1 July and 1 October. Before calculating the differences, we ran a 3-point running mean on each profile individually to smooth out fine structures. Then we filtered out all cases where the absolute value of the difference between ECMWF and MERRA2 was > 50% for H2O and > 10 K for temperature. We applied no threshold to O3 profile differences. We used the same ensemble to create a-priori error covariance matrices for CLIMCAPS temperature and H2O retrievals. This is the only a-priori error estimate that we employ for CLIMCAPS O3. Each O3 retrieval, no matter where on the globe or which day of the year, starts off with the error covariance matrix depicted in Figure 7 as the a-priori error estimate.
Figure 8: Empirical a-priori error covariance matrix used in CLIMCAPS V2 O3 retrievals. We derived this error matrix off-line from an ensemble of co-located ECMWF and MERRA2 profiles as the covariance, δO3 δO3T, of [ECMWF – MERRA2]/[ECMWF] to characterize the error as percentage (see section 2.2.4 of Smith and Barnet, 2019). The colorbar is in log-scale to enhance off-diagonal features.
We depicted the square root of the diagonal vector of this O3 a-priori error covariance matrix (Figure 8) as the grey profile in Figure 4 and notice that it ranges between 20–40% in the troposphere and falls below 10% in the upper stratosphere. It is important to keep in mind that this error covariance matrix we derived does not represent the real error of MERRA2 O3, but merely an estimate given the assumption of ECMWF as the ‘truth’.
2. CLIMCAPS product field names relevant to O3 applications
Within the netCDF files, the following fields are relevant for O3 studies. Each CLIMCAPS file contains 45 scanlines along track (atrack) and 30 FOR along each scanline, or across track (xtrack). With O3 profiles retrieved at each FOR on 100 pressure layers (air_pres_lay), the arrays have dimensions [atrack, xtrack, airs_pres_lay].
Useful conversions:
- 1 kg/m2 = 4.4698e+04 DU = 1.2547e+21 molec/cm2
- 1 DU = 2.1414e-05 kg/m2 = 2.6868e+16 molec/cm2
- 1 molec/cm2 = 3.7219e-17 DU = 7.9703e-22 kg/m2
2.1 Retrieved variables
- mol_lay/o3_mol_lay: CLIMCAPS retrieval of O3 layer column densities [molec/m2] on 100 pressure layers (air_pres_lay), where 1 molec/m2= 1.0e-04 molec/cm2.
2.2 Derived variables
- o3_tot: total column ozone as mass content [kg/m2]
- o3_mmr: mass mixing ratio, or the mass fraction of ozone in dry air [kg/kg] on 100 pressure levels (air_pres), where 1 kg/kg = 10e3 g/kg = 10e6 ppm.
2.2 Quality metrics
- ave_kern/o3_ave_kern: O3 averaging kernel matrix for every retrieval scene.
- o3_dof: The trace of the averaging kernel matrix as a measure of the number of independent pieces of information about O3 at a target scene. For O3, CLIMCAPS typically maintain a DOF below 2.5, which means that CLIMCAPS has sensitivity to the true state of O3 in two vertical layers.
- *_err: The retrieval error estimate for column density (o3_mol_lay), total ozone (o3_tot) and mass mixing ratio (o3_mmr). The error has the same units as the original retrieved or derived variables.
- *_qc: The quality control flag for for column density (o3_mol_lay), total ozone (o3_tot) and mass mixing ratio (o3_mmr). This is the same quality flag used in the retrieved and derived variables.
2.3 O3 a-priori
- aux/fg_o3_mol_lay: MERRA2 a-priori for O3 retrieval in the IR retrieval step. These are the native MERRA2 O3 profiles converted to column densities [molec/m2] and interpolated spatially, temporally and vertically to match the CLIMCAPS retrieval footprints. This field is included in the netCDF file so that you can readily compare the retrieval with its a-priori. Multiply by 1.0e-05 to convert to the more common form of [molec/cm2].
Have a look at other data filtering options that may be relevant to your application, such as separating day from night, land from ocean, clear from cloudy skies, or according to various diagnostic metrics for target applications.
3. References
- Berndt, E. and Folmer, M.: Utility of CrIS/ATMS profiles to diagnose extratropical transition, Results in Physics, 8, 184–185, doi:10.1016/j.rinp.2017.12.006, 2018.
- Cooper, O. R., Parrish, D. D., Ziemke, J., Balashov, N. V., Cupeiro, M., Galbally, I. E., Gilge, S., Horowitz, L., Jensen, N. R., Lamarque, J.-F., Naik, V., Oltmans, S. J., Schwab, J., Shindell, D. T., Thompson, A. M., Thouret, V., Wang, Y. and Zbinden, R. M.: Global distribution and trends of tropospheric ozone: An observation-based review, Elementa: Science of the Anthropocene, 2, 000029, doi:10.12952/journal.elementa.000029, 2014.
- Dreessen, J.: A Sea Level Stratospheric Ozone Intrusion Event Induced within a Thunderstorm Gust Front, Bulletin of the American Meteorological Society, 100(7), 1259–1275, doi:10.1175/BAMS-D-18-0113.1, 2019.
- Gaudel, A., Cooper, O. R., Ancellet, G., Barret, B., Boynard, A., Burrows, J. P., Clerbaux, C., Coheur, P.-F., Cuesta, J., Cuevas, E., Doniki, S., Dufour, G., Ebojie, F., Foret, G., Garcia, O., Granados-Muñoz, M. J., Hannigan, J. W., Hase, F., Hassler, B., Huang, G., Hurtmans, D., Jaffe, D., Jones, N., Kalabokas, P., Kerridge, B., Kulawik, S., Latter, B., Leblanc, T., Le Flochmoën, E., Lin, W., Liu, J., Liu, X., Mahieu, E., McClure-Begley, A., Neu, J. L., Osman, M., Palm, M., Petetin, H., Petropavlovskikh, I., Querel, R., Rahpoe, N., Rozanov, A., Schultz, M. G., Schwab, J., Siddans, R., Smale, D., Steinbacher, M., Tanimoto, H., Tarasick, D. W., Thouret, V., Thompson, A. M., Trickl, T., Weatherhead, E., Wespes, C., Worden, H. M., Vigouroux, C., Xu, X., Zeng, G., Ziemke, J., Helmig, D. and Lewis, A.: Tropospheric Ozone Assessment Report: Present-day distribution and trends of tropospheric ozone relevant to climate and global atmospheric chemistry model evaluation, Elem Sci Anth, 6, doi:10.1525/elementa.291, 2018.
- Gelaro, R., McCarty, W., Suárez, M. J., Todling, R., Molod, A., Takacs, L., Randles, C. A., Darmenov, A., Bosilovich, M. G., Reichle, R., Wargan, K., Coy, L., Cullather, R., Draper, C., Akella, S., Buchard, V., Conaty, A., da Silva, A. M., Gu, W., Kim, G.-K., Koster, R., Lucchesi, R., Merkova, D., Nielsen, J. E., Partyka, G., Pawson, S., Putman, W., Rienecker, M., Schubert, S. D., Sienkiewicz, M. and Zhao, B.: The Modern-Era Retrospective Analysis for Research and Applications, Version 2 (MERRA-2), Journal of Climate, 30(14), 5419–5454, doi:10.1175/JCLI-D-16-0758.1, 2017.
- GMAO: MERRA-2 inst3_3d_asm_Nv: 3d,3-Hourly,Instantaneous,Model-Level,Assimilation,Assimilated Meteorological Fields V5.12.4, , doi:10.5067/WWQSXQ8IVFW8, 2015.
- Gray, E.: 2019 Ozone Hole Is the Smallest on Record Since Its Discovery, The Earth Observer, 31(6), 34–35, 2019.
- Langford, A. O., Alvarez, R. J., Brioude, J., Evan, S., Iraci, L. T., Kirgis, G., Kuang, S., Leblanc, T., Newchurch, M. J., Pierce, R. B., Senff, C. J. and Yates, E. L.: Coordinated profiling of stratospheric intrusions and transported pollution by the Tropospheric Ozone Lidar Network (TOLNet) and NASA Alpha Jet experiment (AJAX): Observations and comparison to HYSPLIT, RAQMS, and FLEXPART, Atmospheric Environment, 174, 1–14, doi:10.1016/j.atmosenv.2017.11.031, 2018.
- Rosenkranz, P. W.: Retrieval of temperature and moisture profiles from AMSU-A and AMSU-B measurements, IEEE Transactions on Geoscience and Remote Sensing, 39(11), 2429–2435, doi:10.1109/36.964979, 2001.
- Rosenkranz, P. W.: Cloud liquid-water profile retrieval algorithm and validation, Journal of Geophysical Research, 111(D9), doi:10.1029/2005JD005832, 2006.
- Smith, N. and Barnet, C. D.: Uncertainty Characterization and Propagation in the Community Long-Term Infrared Microwave Combined Atmospheric Product System (CLIMCAPS), Remote Sensing, 11(10), 1227, doi:10.3390/rs11101227, 2019.
- Smith, N. and Barnet, C. D.: CLIMCAPS observing capability for temperature, moisture, and trace gases from AIRS/AMSU and CrIS/ATMS, Atmos. Meas. Tech., 13, 4437–4459, https://doi.org/10.5194/amt-13-4437-2020, 2020.
- Strow, L. L., Hannon, S. E., De Souza-Machado, S., Motteler, H. E. and Tobin, D.: An overview of the AIRS radiative transfer model, IEEE Transactions on Geoscience and Remote Sensing, 41(2), 303–313, doi:10.1109/TGRS.2002.808244, 2003.
- Wargan, K., Labow, G., Frith, S., Pawson, S., Livesey, N. and Partyka, G.: Evaluation of the Ozone Fields in NASA’s MERRA-2 Reanalysis, Journal of Climate, 30(8), 2961–2988, doi:10.1175/JCLI-D-16-0699.1, 2017.
- Wargan, K., Orbe, C., Pawson, S., Ziemke, J. R., Oman, L. D., Olsen, M. A., Coy, L. and Emma Knowland, K.: Recent Decline in Extratropical Lower Stratospheric Ozone Attributed to Circulation Changes, Geophysical Research Letters, 45(10), 5166–5176, doi:10.1029/2018GL077406, 2018.
- Wargan, K., Kramarova, N., Weir, B., Pawson, S. and Davis, S. M.: Toward a Reanalysis of Stratospheric Ozone for Trend Studies: Assimilation of the Aura Microwave Limb Sounder and Ozone Mapping and Profiler Suite Limb Profiler Data, Journal of Geophysical Research: Atmospheres, 125(4), doi:10.1029/2019JD031892, 2020.
- Witze, A.: Rare ozone hole opens over Arctic — and it’s big, Nature, 580(7801), 18–19, doi:10.1038/d41586-020-00904-w, 2020.

