News | February 28, 2022
AIRS observations of the Tonga undersea volcano eruptions in January 2022
In January 2022, the Hunga Tonga-Hunga Ha’apai volcano erupted twice (4:20 am on the 14th and 5:14 pm on the 15th local time), sending plumes of ash, steam, and gas more than 30 kilometers high and causing unprecedented gravity, shock, and sound waves to move through the global atmosphere. Unusual atmospheric gravity wave patterns, with dozens of concentric circles stretching over a vast region, and a mixture of wave sizes and types, are unlike anything seen in previous volcanic events in the AIRS record extending almost 20 years. The eruptions also produced large amounts of sulfur dioxide (SO2) and dust. AIRS observations of atmospheric waves and volcanic plumes created by the eruptions have led to the insights described below.
AIRS captures unprecedented gravity waves from the Tonga volcanic eruption on January 15
At 5:14 pm local time on January 15th (4:14 am January 15th UTC), the Tonga volcano erupted explosively, triggering an enormous release of energy that spread outwards. This violent eruption created shock and sound waves that were felt in the Fiji Islands approximately 500 kilometers to the northwest, in New Zealand approximately 1800 kilometers to the southwest, and roughly 10,000 kilometers away in Alaska about 9 hours later.
Gravity wave perturbations also propagated vertically from the eruption, disturbing the air column as high as the ionosphere. The AIRS instrument measures infrared radiances (referred to as Level-1 data) at many different wavelengths, with some wavelengths sensitive to temperatures at a certain height range in the atmosphere. Inspired by stories in Nature and EOS that reported large, concentric temperature wave patterns identified by Dr. Lars Hoffmann from Jülich Supercomputing Centre in Germany, Figure 1 shows the AIRS 4.3 micrometer (μm) radiance about 6 to 12 hours after the eruption. The 4.3 μm radiance is emitted from 30 to 40 km, indicating that the waves created by the burst of energy had travelled from the ocean surface to this altitude in a few hours.

The wave patterns can be seen in the AIRS temperature retrievals (referred to as Level-2 data) as well as in the AIRS radiances (Level-1 data) just shown. The left column of Figure 2 shows the stratospheric temperatures at pressures of 1, 2 and 3 hPa (moving downward from about 50 to 30 kilometers in altitude, covering most of the stratosphere), where concentric ripples in temperature can be seen. After removing the large-scale background temperature structure, the wave patterns become even more distinct (right column in Figure 2).

AIRS observations of volcanic sulfur dioxide plumes
The Tonga volcano had a smaller eruption starting at 4:20 am local time on January 14th (3:20 pm UTC on January 13th), about one day before the massive eruption on January 15th. This earlier eruption reportedly had a radius of at least 260 kilometers (about 160 miles), sending plumes of ash and sulfur dioxide (SO2) into the air and reaching a height of at least 20 kilometers. The difference between brightness temperatures measured by AIRS at two bands, 7.3 μm (wavenumber 1361.44 cm-1) and 7.0 μm (wavenumber 1433.06 cm-1), is a reliable indicator of the existence of volcanic SO2 plumes. Figure 3 shows AIRS observations of SO2 plumes about 10 and 22 hours after this eruption.

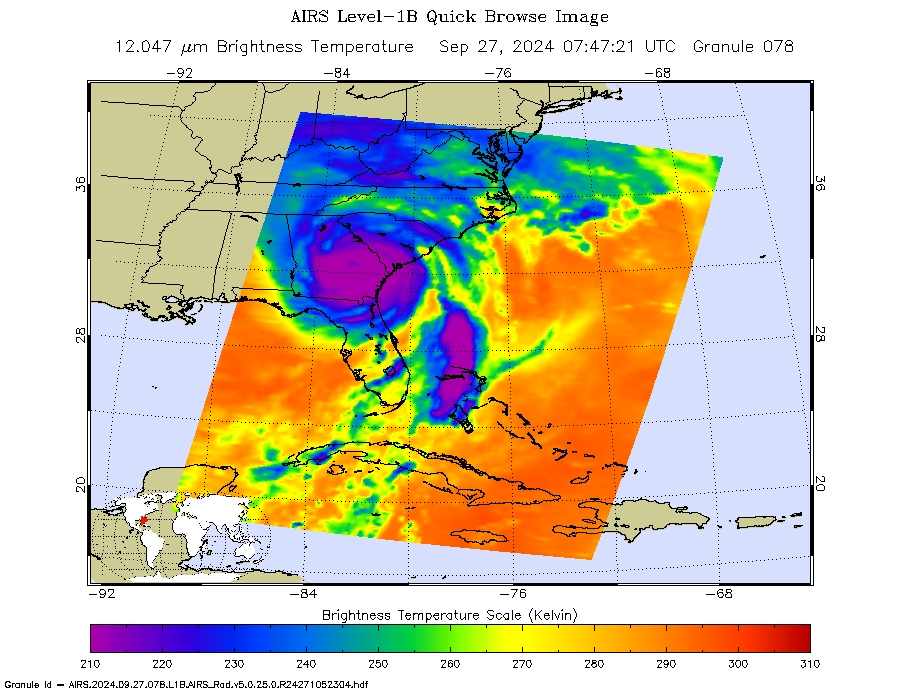
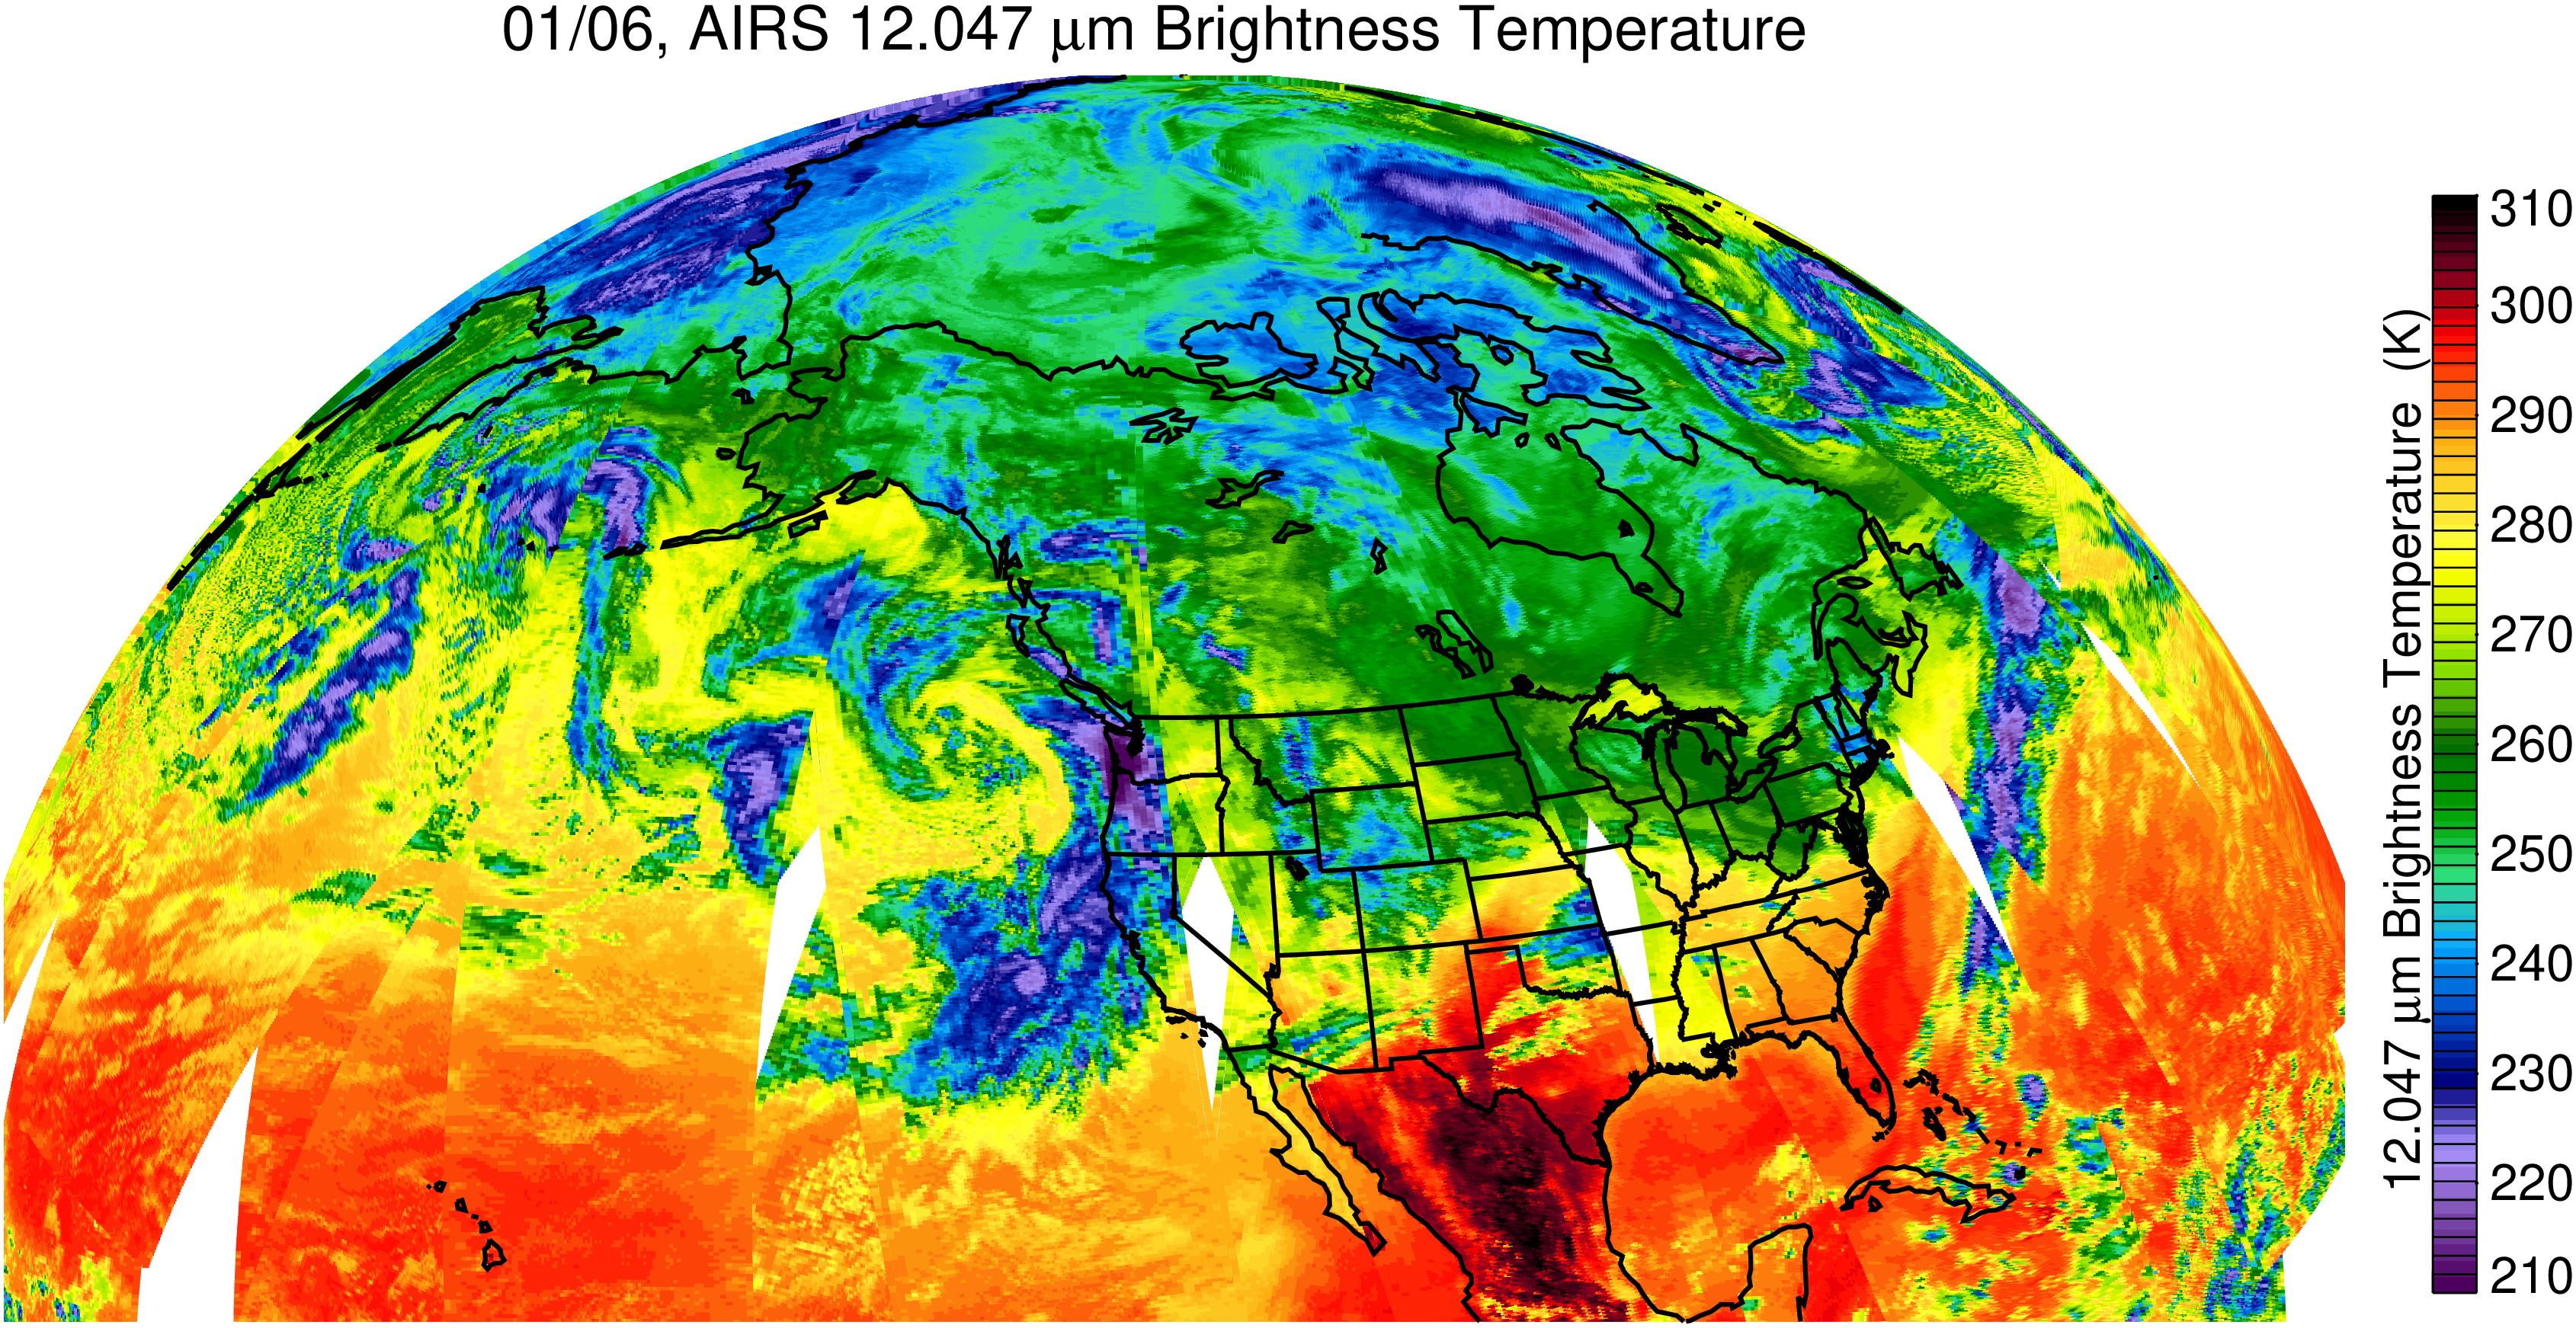
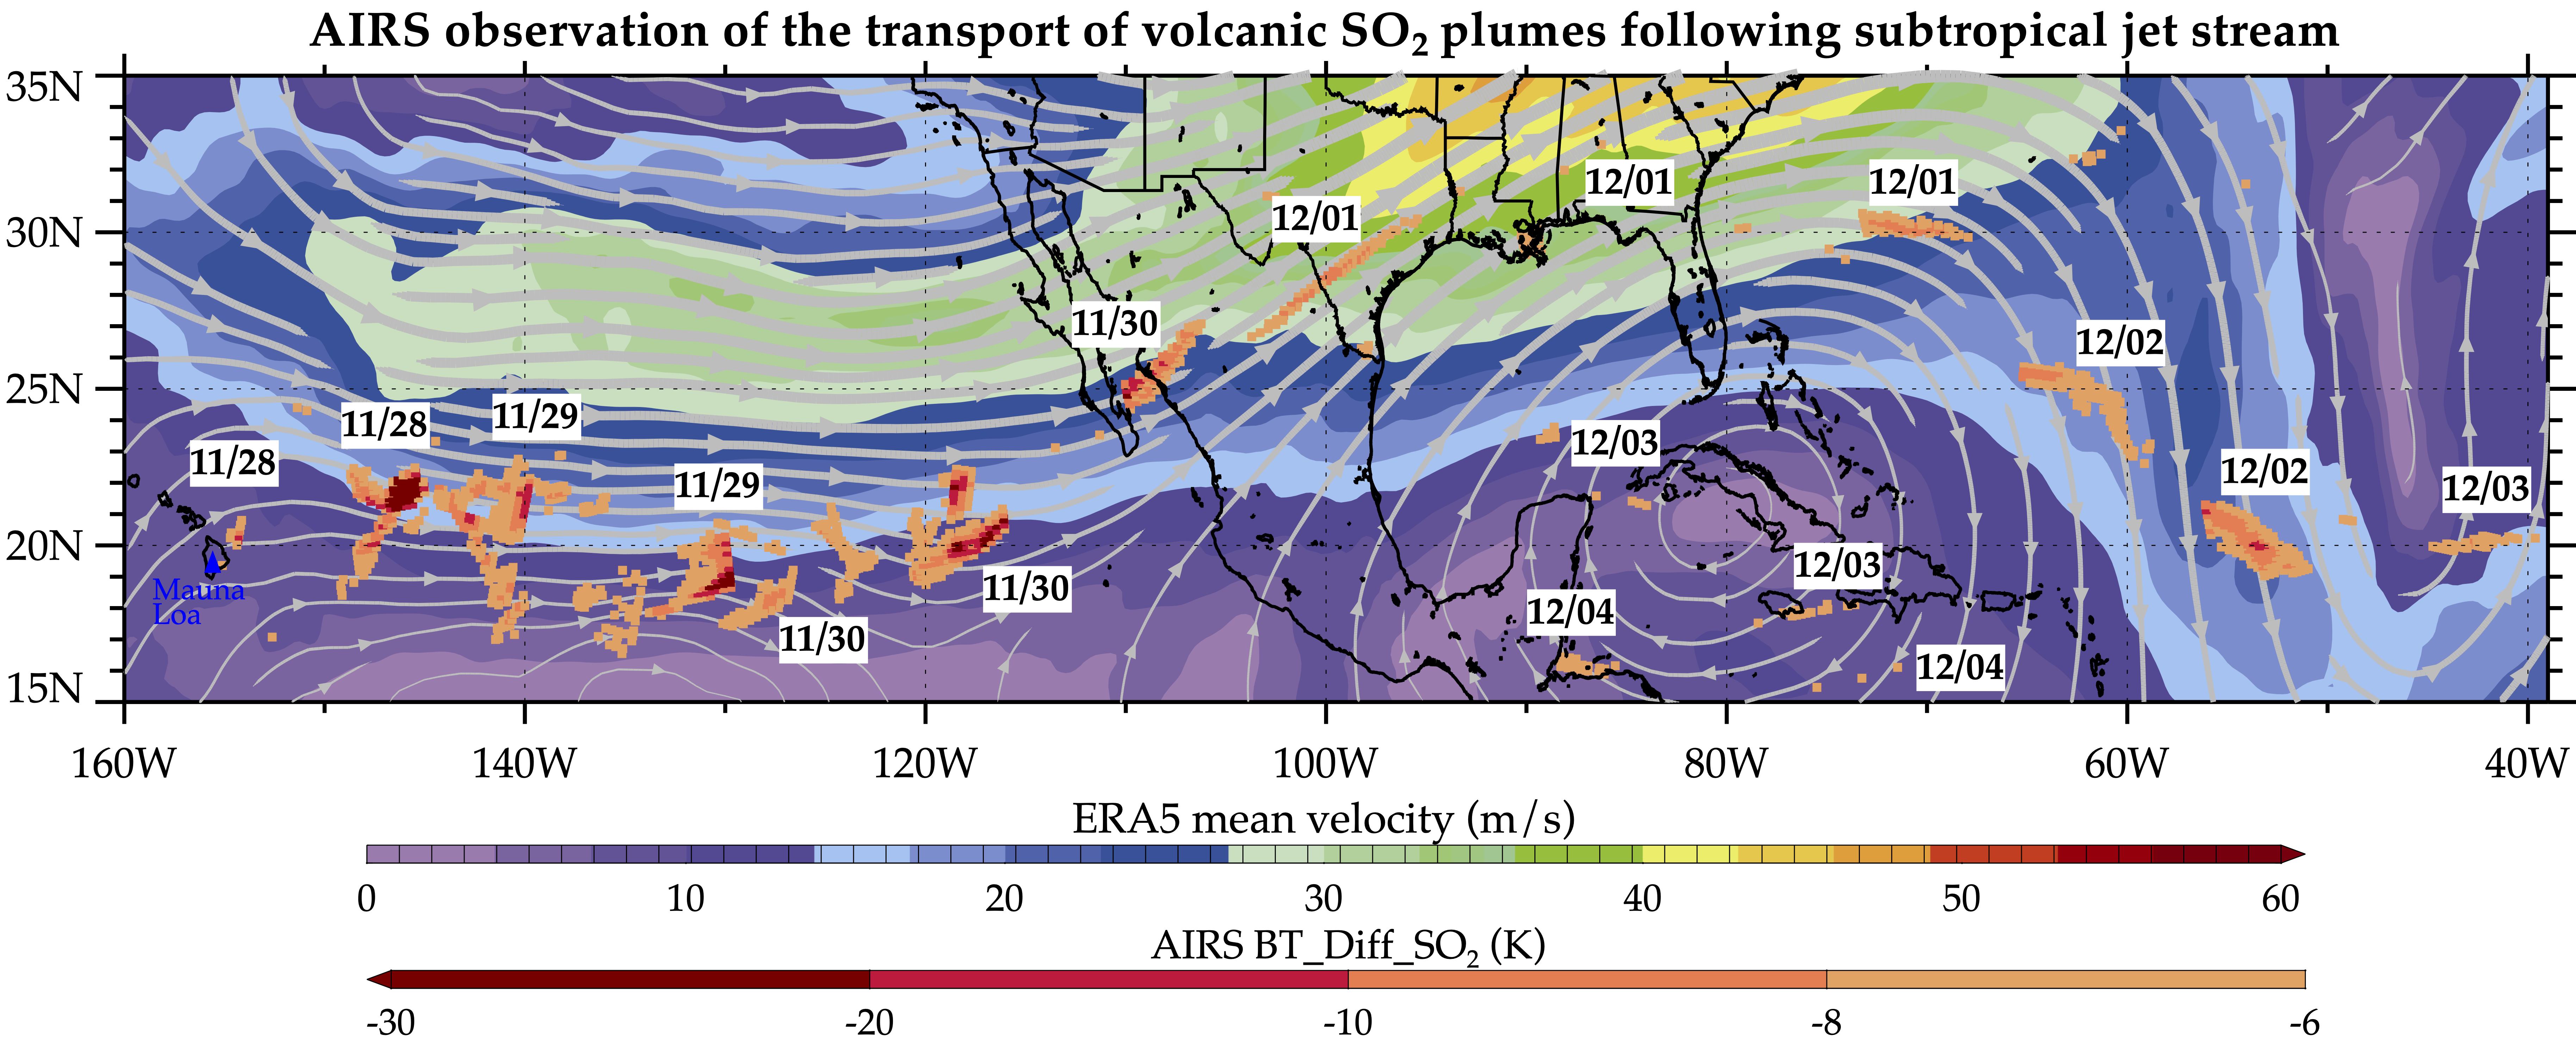
An even larger amount of SO2 was emitted into the atmosphere in the massive January 15 eruption, and AIRS captures the daily transport of SO2 plumes afterward. The Aqua satellite that carries the AIRS instrument passes over a given region twice per day on its polar orbit, at local daytime around 1:30 pm in the ascending (northward) branch of the orbit, and local nighttime around 1:30 am in the descending (southward) branch of the orbit. Figure 4 shows all AIRS ascending and descending granules covering the region of interest. A large SO2 plume is seen following the prevailing winds westward.

AIRS observations of dust
Besides detecting gravity waves and SO2 plumes, AIRS is also capable of detecting dust, including volcanic ash. Figure 5 below shows the dust score from AIRS radiances (Level-1 data) about 8 hours after the eruption occurred. The dust score is derived from brightness temperature differences between several pairs of channels (or wavelengths), with score >= 380 (red) in Figure 5 indicating a cloud of dust accompanying the SO2 shown in Figure 4. Note that currently AIRS dust score indicates thick dust plumes; AIRS is capable of detecting thinner dust plumes but this remains an active area of investigation.

Further thoughts
AIRS observations of Sulfur dioxide (SO2) and ash are routinely used in near real-time (NRT) monitoring of volcanic emissions. AIRS SO2 data are used operationally by NOAA to send notifications of high SO2 concentrations to the Washington D.C. Volcanic Ash Advisory Centers (VAAC) for the purpose of aviation hazard mitigation. A fully automated volcanic plume detection rapid response system that uses AIRS near real-time data has also been developed at the Jet Propulsion Laboratory. This tool is available at the AIRS Rapid Response website, where AIRS detections of the most recent volcanic SO2, dust, clouds, visible and infrared images are updated in near real-time when a volcanic event anywhere on the globe triggers the system. AIRS historical detections of volcanic SO2 and dust are archived on the site at https://airs.jpl.nasa.gov/volcanic_plumes/.
Images and story by Tao Wang and the AIRS team, Jet Propulsion Laboratory, California Institute of Technology.