NASA
Jet Propulsion Laboratory California Institute of Technology
Skip Navigation
AIRS
Stay Connected
menu close modal
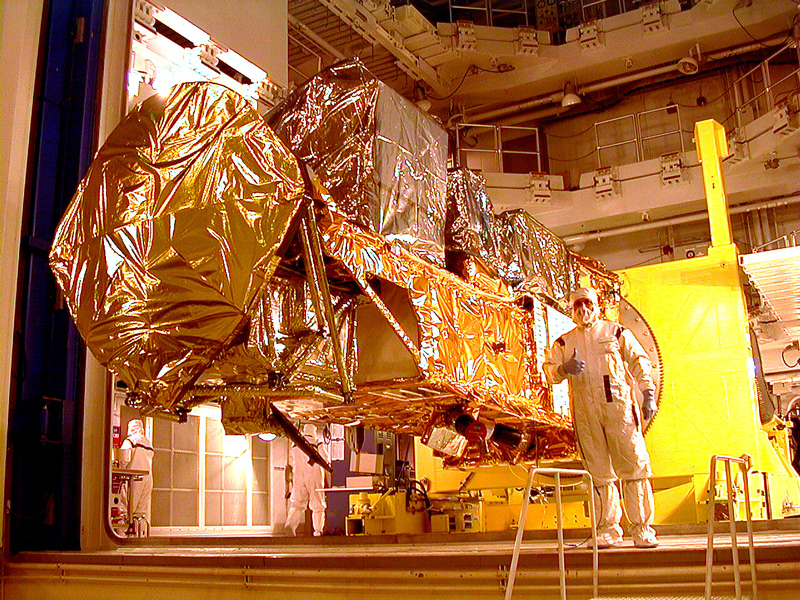
Multimedia

NASA's Aqua satellite in high bay

NASA's Aqua satellite in high bay
Source: NASA/JPL AIRS Project
Published: July 3, 2019

NASA's Aqua satellite in high bay

ENLARGE

Downloads

1.02 MB
image/jpeg
Download

More Like This

  • Images
  • AIRS and AQUA

Related

Zonal average AIRS cloud frequency and cloud fraction for a total of 5 days in late 2006. Latitude bins are 5 degrees in width and height bins are 0.5 km in depth. 
More
Zonal Average AIRS Cloud Frequency and Cloud Fraction
These false-color images show the amount of atmospheric water vapor observed by AIRS two weeks prior to the passage of Hurricane Isabel, and then when it was a Category 5 storm. 
More
Amount of Atmospheric Water Vapor in Hurricane Isabel as Observed By AIRS
This map created with data from the Atmospheric Infrared Sounder (AIRS) on NASA's Aqua satellite shows the concentration of carbon dioxide in Earth's mid-troposphere, located roughly between 3 to 6...
More
Carbon Dioxide in Earth's Mid-Troposphere, April 2013 Monthly Average
This animation shows how light energy is collected by the optics system on the Atmospheric Infrared Sounder (AIRS) instrument and digitized.
More
This animation shows how light energy is collected by the optics system on the Atmospheric Infrared Sounder (AIRS) instrument and digitized.
Light Travels Through AIRS Optics
This visualization shows 3D volumetric water vapor data from the Aqua/Atmospheric Infrared Sounder (AIRS) instrument.
More
Water Vapor In Storm Front Near Southern California, January 2003
The Atmospheric Infrared Sounder, AIRS, was launched aboard the Aqua Spacecraft in 2002 as part of NASA's Earth Observing System Afternoon Constellation of satellites known as the 'A-Train.
More
Arctic Carbon Dioxide, March 23, 2010
AIRS, AMSU, HSB on NASA's Aqua satellite
More
AIRS, AMSU, HSB on NASA's Aqua satellite
NASA's Aqua satellite in high bay, prepare to hoist
More
NASA's Aqua satellite in high bay, prepare to hoist
NASA's Aqua satellite in high bay
More
NASA's Aqua satellite in high bay
In late July 2010, flooding caused by heavy monsoon rains began in several regions of Pakistan, including the Khyber Pakhtunkhwa, Sindh, Punjab and parts of Baluchistan.
More
Extent of Pakistan Flooding
The continuing heat wave in the United States in July 2011 has broken temperature records in many locations, killed dozens and seen nearly half of all Americans under heat advisories at its peak.
More
Evolution of U.S. 2011 Heat Wave
This visualization shows 3D volumetric water vapor data from the Aqua/Atmospheric Infrared Sounder (AIRS) instrument.
More
Water Vapor In Storm Front Near Southern California, January 2003
NASA’s latest Earth Observing System (EOS) satellite — Aqua — successfully launched Saturday morning, May 4, 2002.
More
Artist's rendering of NASA's Aqua Satellite Orbiting Earth
AIRS brightness temperature differences indicating sulfur dioxide plumes (red) at different times after the Mauna Loa volcanic eruption.
More
AIRS brightness temperature differences indicating sulfur dioxide plumes (red) at different times after the Mauna Loa volcanic eruption.
AIRS Tracks Volcanic Sulfur Dioxide Plume from Mauna Loa to Texas over Three Days
NASA's Earth observing satellite, Aqua, successfully launched at 2:55 a.m. PDT on ay 4, 2002.
More
NASA Aqua Satellite Launch
The Atmospheric Infrared Sounder (AIRS) instrument on NASA's Aqua spacecraft captured this infrared image of the first of a series of storms approaching the Pacific Northwest at 2141 UTC (1:41 p.m....
More
West Coast Atmospheric River Event November 2012
This plot shows the concentration of carbon dioxide in Earth's mid-troposphere at various latitudes as measured by the Atmospheric Infrared Sounder (AIRS) instrument on NASA's Aqua satellite.
More
Zonally Averaged Carbon Dioxide Concentration from Earth's Mid-Troposphere at Different Latitudes, 2002 to 2013
Supertyphoon Pongsona over Guam, December 8, 2002. The image is a composite made by overlaying data from the infrared, microwave, and visible/near infrared sensors that make up the AIRS sounding sy...
More
Supertyphoon Pongsona over Guam, 2002
This image is the AIRS-retrieved global tropospheric methane for August 2005.
More
Global Tropospheric Methane for August 2005
Although originally designed to measure atmospheric water vapor and temperature profiles for weather forecasting, data from the Atmospheric Infrared Sounder (AIRS) instrument on NASA's Aqua spacecr...
More
Global Carbon Dioxide, July 2003
This image was created with data acquired by the Atmospheric Infrared Sounder instrument (AIRS) on NASA's Aqua satellite during July 2009.
More
Global Carbon Dioxide Transport from AIRS Data, July 2009
This image shows a detection of sulfur dioxide in AIRS data taken about two days after the Tonga volcano eruptions in January 2022. 
More
This image shows a detection of sulfur dioxide in AIRS data taken about two days after the Tonga volcano eruptions in January 2022.
Sulfur Dioxide Detected After Tonga Volcano Eruption in 2022
Global carbon monoxide measurements from NASA's Atmospheric Infrared Sounder are important because scientists can monitor the transport of fire emissions around the globe on a daily basis.
More
Global Carbon Monoxide, September 29, 2005
AIRS radiances and standard retrievals were used to obtain thin cirrus particle size and optical depth over the tropical oceans.
More
Tropical thin cirrus retrievals of particle size and optical depth from AIRS
Tropical Storm Isidore was born in mid-September north of Venezuela.
More
Flooding Resulting From Hurricane Isidore: Difference image, Sept 12 and 28, 2002
more resources

News & Features

The figure shows the impact of the annual mean increase of CO2 on different ‘colors’ (wavenumbers) of infrared radiation emitted by the Earth’s atmosphere from theory (in red) and measured by the AIRS instrument (in blue)
More
Confirming a Critical Foundation of the Science of Global Warming
Infrared image of Hurricane Helene after landfall in Florida
More
NASA's AIRS Instrument Captures Hurricane Helene
AIRS image showing Hurricane Hilary off the coast of Mexico in brightness temperature at infrared wavelenghts
More
Hurricane Hilary Captured by NASA's AIRS
Cold California weather after polar vortex breakdown captured by AIRS
More
February Cold in California as Captured by AIRS
Atmospheric River Storms hitting the US West Coast shown with AIRS brightness temperature data
More
California Atmospheric River Storms Captured by NASA's AIRS
Surface air temperature maps with geopotential height contours overlaid over North America and the Arctic on December 13th and 22nd, 2022, showing the breaking polar vortex and extremely cold air plunging into the US.
More
AIRS Captures Extreme Cold Air Outbreak Sweeping Across North America
All News

Stay Connected

Home

Sounding Science

    • Overview
    • What is Sounding?
    • Weather
    • Climate
    • Composition
    • Significant Findings
    • Publications
    • Sounding Science at JPL

Mission

    • Overview
    • Science Objectives
    • AIRS Project Instrument Suite
    • Instrument Operations
    • Instrument Calibration
    • People

Data

    • About the Data
    • About the Products
    • Get Data
    • User Guides & Documentation
    • Validation
    • Outages
    • Readers & Tools
    • View Data
    • Support

Applications

    • Health
    • Volcano
    • Drought
    • Wildfire
    • Weather

Multimedia

Science Meetings

    • Science Team Meetings
    • Sounder Discipline Monthly Telecons
  • Feedback
  • |
  • Ask AIRS
  • |
  • Privacy
  • |
  • News

Site manager and webmaster: Heidar Thor Thrastarson