NASA
Jet Propulsion Laboratory California Institute of Technology
Skip Navigation
AIRS
Stay Connected
menu close modal
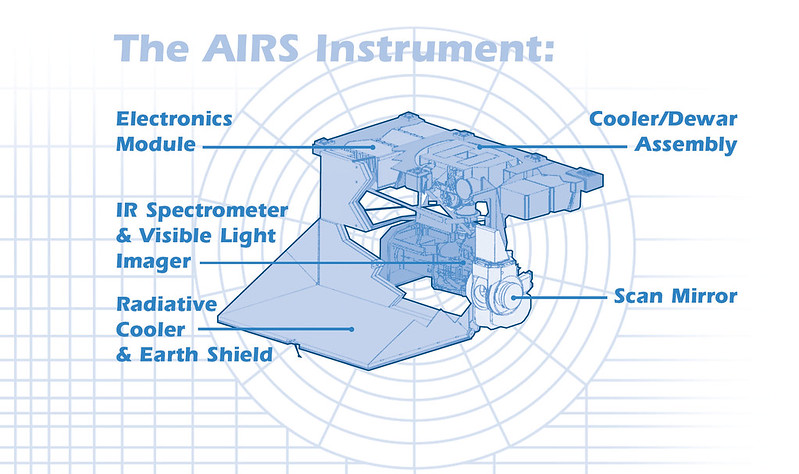
Multimedia

Atmospheric Infrared Sounder instrument sections

Atmospheric Infrared Sounder instrument sections
Published: July 3, 2019

Atmospheric Infrared Sounder instrument sections

ENLARGE

Downloads

971 KB
image/jpeg
Download

More Like This

  • Graphics
  • Images
  • AIRS and AQUA

Related

The carbon cycle refers to the continuous movement of carbon, the most abundant element on the planet, through the oceans, land, atmosphere, fossil fuels and all life on Earth.
More
Global Carbon Cycle
Global Carbon Cycle
Global carbon monoxide measurements from NASA's Atmospheric Infrared Sounder are important because scientists can monitor the transport of fire emissions around the globe on a daily basis.
More
Global Carbon Monoxide, September 26, 2005
This diagram of the fast carbon cycle shows the movement of carbon between land, atmosphere, and oceans. Yellow numbers are natural fluxes, and red are human contributions in gigatons of carbon per...
More
Fast Carbon Cycle
Fast Carbon Cycle
This image was created with data acquired by the Atmospheric Infrared Sounder instrument (AIRS) on NASA's Aqua satellite during July 2009.
More
Global Carbon Dioxide Transport from AIRS Data, July 2009
Locations of Trace Gas Absorption in the AIRS Infrared Radiance Spectrum
More
Locations of Trace Gas Absorption in the AIRS Infrared Radiance Spectrum
NASA’s latest Earth Observing System (EOS) satellite — Aqua — successfully launched Saturday morning, May 4, 2002.
More
Artist's rendering of NASA's Aqua Satellite
Bias (solid) and ±1 sigma variability (dashed) of CloudSat-AIRS cloud top height differences for V4 (black) and V5 (red), and for the upper (top panel) and lower (bottom panel).
More
Bias and Variability of CloudSat-AIRS cloud top height differences for V4 and V5
Shown here is the latest infrared image of Yasi from the Atmospheric Infrared Sounder (AIRS) instrument on NASA's Aqua satellite, built and managed by NASA's Jet Propulsion Laboratory, Pasadena, Ca...
More
Monster Cyclone Yasi Eyes Australia 2011
This visualization shows 3D volumetric water vapor data from the Aqua/Atmospheric Infrared Sounder (AIRS) instrument.
More
Water Vapor In Storm Front Near Southern California, January 2003
Widespread forest fires across Indonesia have burned tens of thousands of acres over three months, causing high levels of pollution, loss of life, and billions of dollars to the Indonesian governme...
More
Carbon Monoxide in Mid-Troposphere over Indonesia Fires, October 26-28, 2015
NASA’s latest Earth Observing System (EOS) satellite — Aqua — successfully launched Saturday morning, May 4, 2002.
More
Artist's rendering of NASA's Aqua Satellite Orbiting Earth
NASA's Aqua satellite in high bay
More
NASA's Aqua satellite in high bay
More
NASA's Aqua satellite in high bay
More
NASA's Aqua satellite in high bay
NASA's Aqua satellite in high bay, prepare to hoist
More
NASA's Aqua satellite in high bay, prepare to hoist
Earth’s water continuously moves through the atmosphere, into and out of the oceans, over the land surface, and underground.
More
The Water Cycle
The Water Cycle
The continuing heat wave in the United States in July 2011 has broken temperature records in many locations, killed dozens and seen nearly half of all Americans under heat advisories at its peak.
More
Evolution of U.S. 2011 Heat Wave
NASA's Earth observing satellite, Aqua, successfully launched at 2:55 a.m. PDT on ay 4, 2002.
More
NASA Aqua Satellite Launch
The Atmospheric Infrared Sounder, AIRS, was launched aboard the Aqua Spacecraft in 2002 as part of NASA's Earth Observing System Afternoon Constellation of satellites known as the 'A-Train.
More
Arctic Carbon Dioxide, March 23, 2010
Poster: AIRS Monitoring Earth's Atmosphere
More
Poster: AIRS Monitoring Earth's Atmosphere
Zonal average AIRS cloud frequency and cloud fraction for a total of 5 days in late 2006. Latitude bins are 5 degrees in width and height bins are 0.5 km in depth. 
More
Zonal Average AIRS Cloud Frequency and Cloud Fraction
Water Cycle
More
Water Cycle
Water Cycle
This image represents the total precipitable water vapor for May, 2009 as observed by AIRS, the Atmospheric Infrared Sounder (AIRS) on NASA's Aqua satellite.
More
Global Total Precipitable Water Vapor for May 2009
Northeast Africa continues to reel from the effects of the worst drought to strike the region in decades. 
More
Severity of African Drought
NASA's Earth observing satellite, Aqua, successfully launched at 2:55 a.m. PDT on ay 4, 2002.
More

NASA Aqua Satellite Launch
more resources

News & Features

Satellite imagery from AIRS captures sulfur dioxide plumes from Hayli Gubbi volcanic eruption in Ethiopia propagating across Asia.
More
AIRS Tracks Plumes from Ethiopian Volcano Across Asia
The figure shows the impact of the annual mean increase of CO2 on different ‘colors’ (wavenumbers) of infrared radiation emitted by the Earth’s atmosphere from theory (in red) and measured by the AIRS instrument (in blue)
More
Confirming a Critical Foundation of the Science of Global Warming
Infrared image of Hurricane Helene after landfall in Florida
More
NASA's AIRS Instrument Captures Hurricane Helene
AIRS image showing Hurricane Hilary off the coast of Mexico in brightness temperature at infrared wavelenghts
More
Hurricane Hilary Captured by NASA's AIRS
Cold California weather after polar vortex breakdown captured by AIRS
More
February Cold in California as Captured by AIRS
Atmospheric River Storms hitting the US West Coast shown with AIRS brightness temperature data
More
California Atmospheric River Storms Captured by NASA's AIRS
All News

Stay Connected

Home

Sounding Science

    • Overview
    • What is Sounding?
    • Weather
    • Climate
    • Composition
    • Significant Findings
    • Publications
    • Sounding Science at JPL

Mission

    • Overview
    • Science Objectives
    • AIRS Project Instrument Suite
    • Instrument Operations
    • Instrument Calibration
    • People

Data

    • About the Data
    • About the Products
    • Get Data
    • User Guides & Documentation
    • Validation
    • Outages
    • Readers & Tools
    • View Data
    • Support

Applications

    • Overview
    • Weather
    • Volcano
    • Drought
    • Wildfire
    • Health

Multimedia

Science Meetings

    • Science Team Meetings
    • Sounder Discipline Monthly Telecons
  • Feedback
  • |
  • Ask AIRS
  • |
  • Privacy
  • |
  • News

Site manager and webmaster: Heidar Thor Thrastarson