Fast Carbon Cycle

Source:
Diagram adapted from U.S. DOE, Biological and Environmental Research Information System.
Published:
July 8, 2019
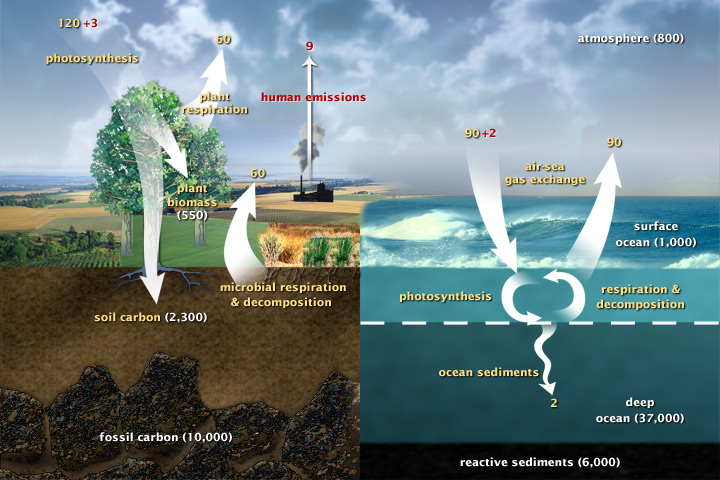
This diagram of the fast carbon cycle shows the movement of carbon between land, atmosphere, and oceans. Yellow numbers are natural fluxes, and red are human contributions in gigatons of carbon per year. White numbers indicate stored carbon.


