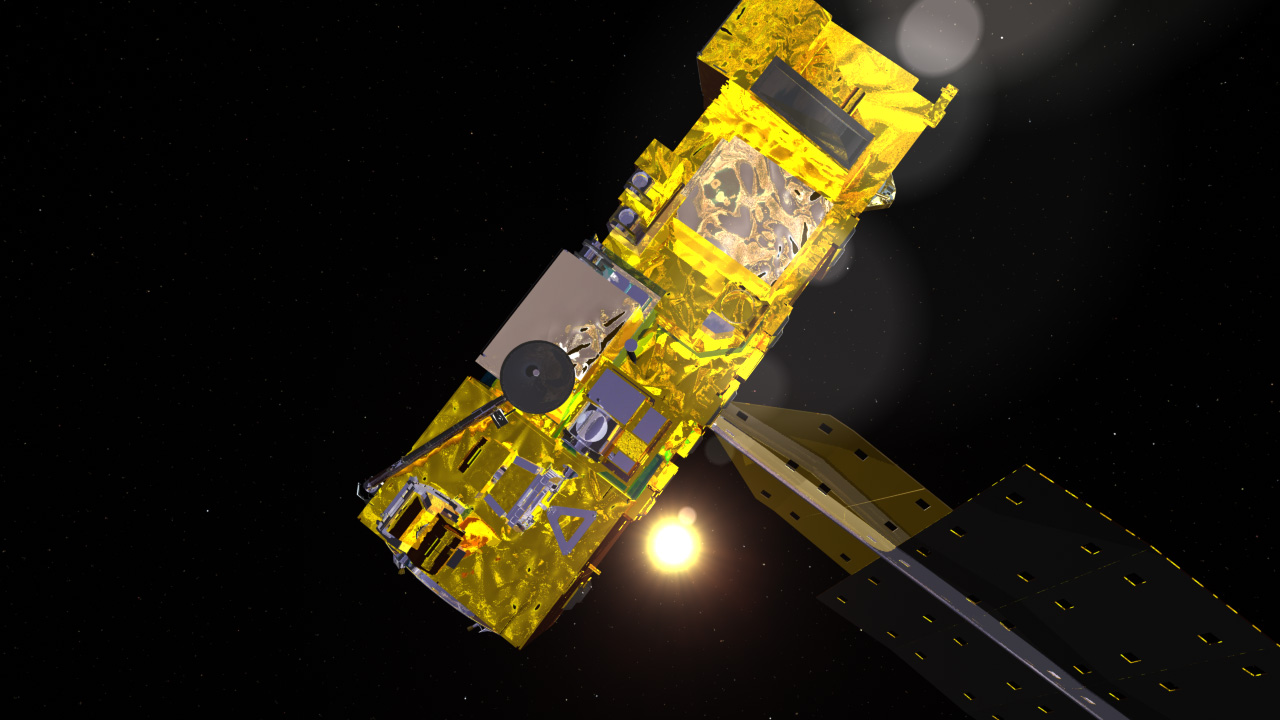
NASA
Jet Propulsion Laboratory California Institute of Technology
Skip Navigation
AIRS
Stay Connected
menu close modal
Multimedia

NASA's Aqua satellite

NASA's Aqua satellite
Source: NASA
Published: July 8, 2019

Artist's concept of NASA's Aqua satellite launched May 4, 2002.

ENLARGE

Downloads

214 KB
image/jpeg
Download

More Like This

  • Images
  • AIRS and AQUA

Related

In late July 2010, flooding caused by heavy monsoon rains began in several regions of Pakistan, including the Khyber Pakhtunkhwa, Sindh, Punjab and parts of Baluchistan.
More
Extent of Pakistan Flooding
NASA’s Atmospheric Infrared Sounder (AIRS) captured views of Hurricane Ida, both before it made landfall in the early morning hours (2:53 CDT) and approximately two hours after the storm's landfall...
More
infrared image Hurricane Ida before making landfall
AIRS captures Hurricane Ida before and after landfall
The Atmospheric Infrared Sounder, AIRS, was launched aboard the Aqua Spacecraft in 2002 as part of NASA's Earth Observing System Afternoon Constellation of satellites known as the 'A-Train.
More
Arctic Carbon Dioxide, March 23, 2010
Global carbon monoxide measurements from NASA's Atmospheric Infrared Sounder are important because scientists can monitor the transport of fire emissions around the globe on a daily basis.
More
Global Carbon Monoxide, September 29, 2005
These sub-panels show differences in the characteristics of RHic histograms within thin cirrus clouds for different regions and time periods.
More
Relative humidity distributions within thin cirrus for several regions and inter-annual variations in the Indian Ocean
NASA's Earth observing satellite, Aqua, successfully launched at 2:55 a.m. PDT on ay 4, 2002.
More
NASA Aqua Satellite Launch
Infrared image of Hurricane Beryl, close to the time of landfall near Houston, Texas, in the early morning of July 8, 2024
More
In the infrared image of Hurricane Beryl, close to the time of landfall near Houston, Texas, in the early morning of July 8, 2024, the large purple areas indicate very cold clouds carried high into the atmosphere by deep thunderstorms and associated with heavy rainfall. Warmer areas with shallower rain clouds are shown in blue and green. The orange and red areas represent mostly cloud-free air.
AIRS Views Hurricane Beryl over Texas Coast
Image of sulfur dioxide detected through AIRS brightness temperature differences several days after Raikoke volcanic eruption in 2019
More
Image of sulfur dioxide detected through AIRS brightness temperature differences several days after Raikoke volcanic eruption in 2019
NASA's AIRS Displays Sulfur Dioxide Plumes After Raikoke Eruption, June 2019
NASA's Aqua satellite in high bay
More
NASA's Aqua satellite in high bay
More
NASA's Aqua satellite in high bay
This image shows a detection of sulfur dioxide in AIRS data taken about two days after the Tonga volcano eruptions in January 2022. 
More
This image shows a detection of sulfur dioxide in AIRS data taken about two days after the Tonga volcano eruptions in January 2022.
Sulfur Dioxide Detected After Tonga Volcano Eruption in 2022
NASA’s Atmospheric Infrared Sounder (AIRS) captured a series of images of Hurricanes Idalia before landfall in Florida and as it crossed the Southeastern United States, including views of Hurricane...
More
A series of AIRS images of Hurricanes Idalia before landfall in Florida and as it crossed the Southeastern United States, including views of Hurricane Franklin in the Atlantic Ocean.
Hurricanes Idalia and Franklin as Viewed by AIRS
NASA's Aqua satellite in high bay, prepare to hoist
More
NASA's Aqua satellite in high bay, prepare to hoist
Atmospheric Infrared Sounder instrument sections
More
Atmospheric Infrared Sounder instrument sections
Both images in the slide show the global spreading of carbon dioxide on the Earth globe as it follows the large scale patterns of the atmospheric general circulations.
More
Mid-Tropospheric Carbon Dioxide at 8-13 km Altitudes, July 2003 and July 2007
Supertyphoon Pongsona over Guam, December 8, 2002. The image is a composite made by overlaying data from the infrared, microwave, and visible/near infrared sensors that make up the AIRS sounding sy...
More
Supertyphoon Pongsona over Guam, 2002
This animation shows how light energy is collected by the optics system on the Atmospheric Infrared Sounder (AIRS) instrument and digitized.
More
This animation shows how light energy is collected by the optics system on the Atmospheric Infrared Sounder (AIRS) instrument and digitized.
Light Travels Through AIRS Optics
This image is the AIRS-retrieved global tropospheric methane for August 2005.
More
Global Tropospheric Methane for August 2005
Trends in the AIRS monthly temperature anomaly at 931 mb from 2003 to 2022 shown on a global map.  
More
Trends in the AIRS monthly temperature anomaly at 931 mb from 2003 to 2022 shown on a global map.
Global map of AIRS temperature trend from 2003 to 2022
This map created with data from the Atmospheric Infrared Sounder (AIRS) on NASA's Aqua satellite shows the concentration of carbon dioxide in Earth's mid-troposphere, located roughly between 3 to 6...
More
Carbon Dioxide in Earth's Mid-Troposphere, April 2013 Monthly Average
AIRS brightness temperature differences indicating sulfur dioxide plumes (red) at different times after the Mauna Loa volcanic eruption.
More
AIRS brightness temperature differences indicating sulfur dioxide plumes (red) at different times after the Mauna Loa volcanic eruption.
AIRS Tracks Volcanic Sulfur Dioxide Plume from Mauna Loa to Texas over Three Days
NASA's Earth observing satellite, Aqua, successfully launched at 2:55 a.m. PDT on ay 4, 2002.
More
NASA Aqua Satellite Launch
The Atmospheric Infrared Sounder (AIRS) instrument on NASA's Aqua spacecraft captured this infrared image of the first of a series of storms approaching the Pacific Northwest at 2141 UTC (1:41 p.m....
More
West Coast Atmospheric River Event November 2012
Shown here is the latest infrared image of Yasi from the Atmospheric Infrared Sounder (AIRS) instrument on NASA's Aqua satellite, built and managed by NASA's Jet Propulsion Laboratory, Pasadena, Ca...
More
Monster Cyclone Yasi Eyes Australia 2011
Tropical Storm Isidore was born in mid-September north of Venezuela.
More
Flooding Resulting From Hurricane Isidore: Difference image, Sept 12 and 28, 2002
more resources

News & Features

The figure shows the impact of the annual mean increase of CO2 on different ‘colors’ (wavenumbers) of infrared radiation emitted by the Earth’s atmosphere from theory (in red) and measured by the AIRS instrument (in blue)
More
Confirming a Critical Foundation of the Science of Global Warming
Infrared image of Hurricane Helene after landfall in Florida
More
NASA's AIRS Instrument Captures Hurricane Helene
AIRS image showing Hurricane Hilary off the coast of Mexico in brightness temperature at infrared wavelenghts
More
Hurricane Hilary Captured by NASA's AIRS
Cold California weather after polar vortex breakdown captured by AIRS
More
February Cold in California as Captured by AIRS
Atmospheric River Storms hitting the US West Coast shown with AIRS brightness temperature data
More
California Atmospheric River Storms Captured by NASA's AIRS
Surface air temperature maps with geopotential height contours overlaid over North America and the Arctic on December 13th and 22nd, 2022, showing the breaking polar vortex and extremely cold air plunging into the US.
More
AIRS Captures Extreme Cold Air Outbreak Sweeping Across North America
All News

Stay Connected

Home

Sounding Science

    • Overview
    • What is Sounding?
    • Weather
    • Climate
    • Composition
    • Significant Findings
    • Publications
    • Sounding Science at JPL

Mission

    • Overview
    • Science Objectives
    • AIRS Project Instrument Suite
    • Instrument Operations
    • Instrument Calibration
    • People

Data

    • About the Data
    • About the Products
    • Get Data
    • User Guides & Documentation
    • Validation
    • Outages
    • Readers & Tools
    • View Data
    • Support

Applications

    • Health
    • Volcano
    • Drought
    • Wildfire
    • Weather

Multimedia

Science Meetings

    • Science Team Meetings
    • Sounder Discipline Monthly Telecons
  • Feedback
  • |
  • Ask AIRS
  • |
  • Privacy
  • |
  • News

Site manager and webmaster: Heidar Thor Thrastarson