News | May 9, 2011
On the Hunt for the Birth of a Hurricane
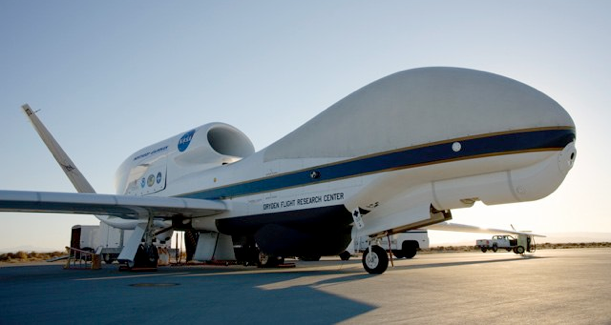
Global Hawk on the tarmac at NASA Dryden Flight Research Facility. Photo: DFRC
By Rosemary Sullivant, NASA/Jet Propulsion Laboratory
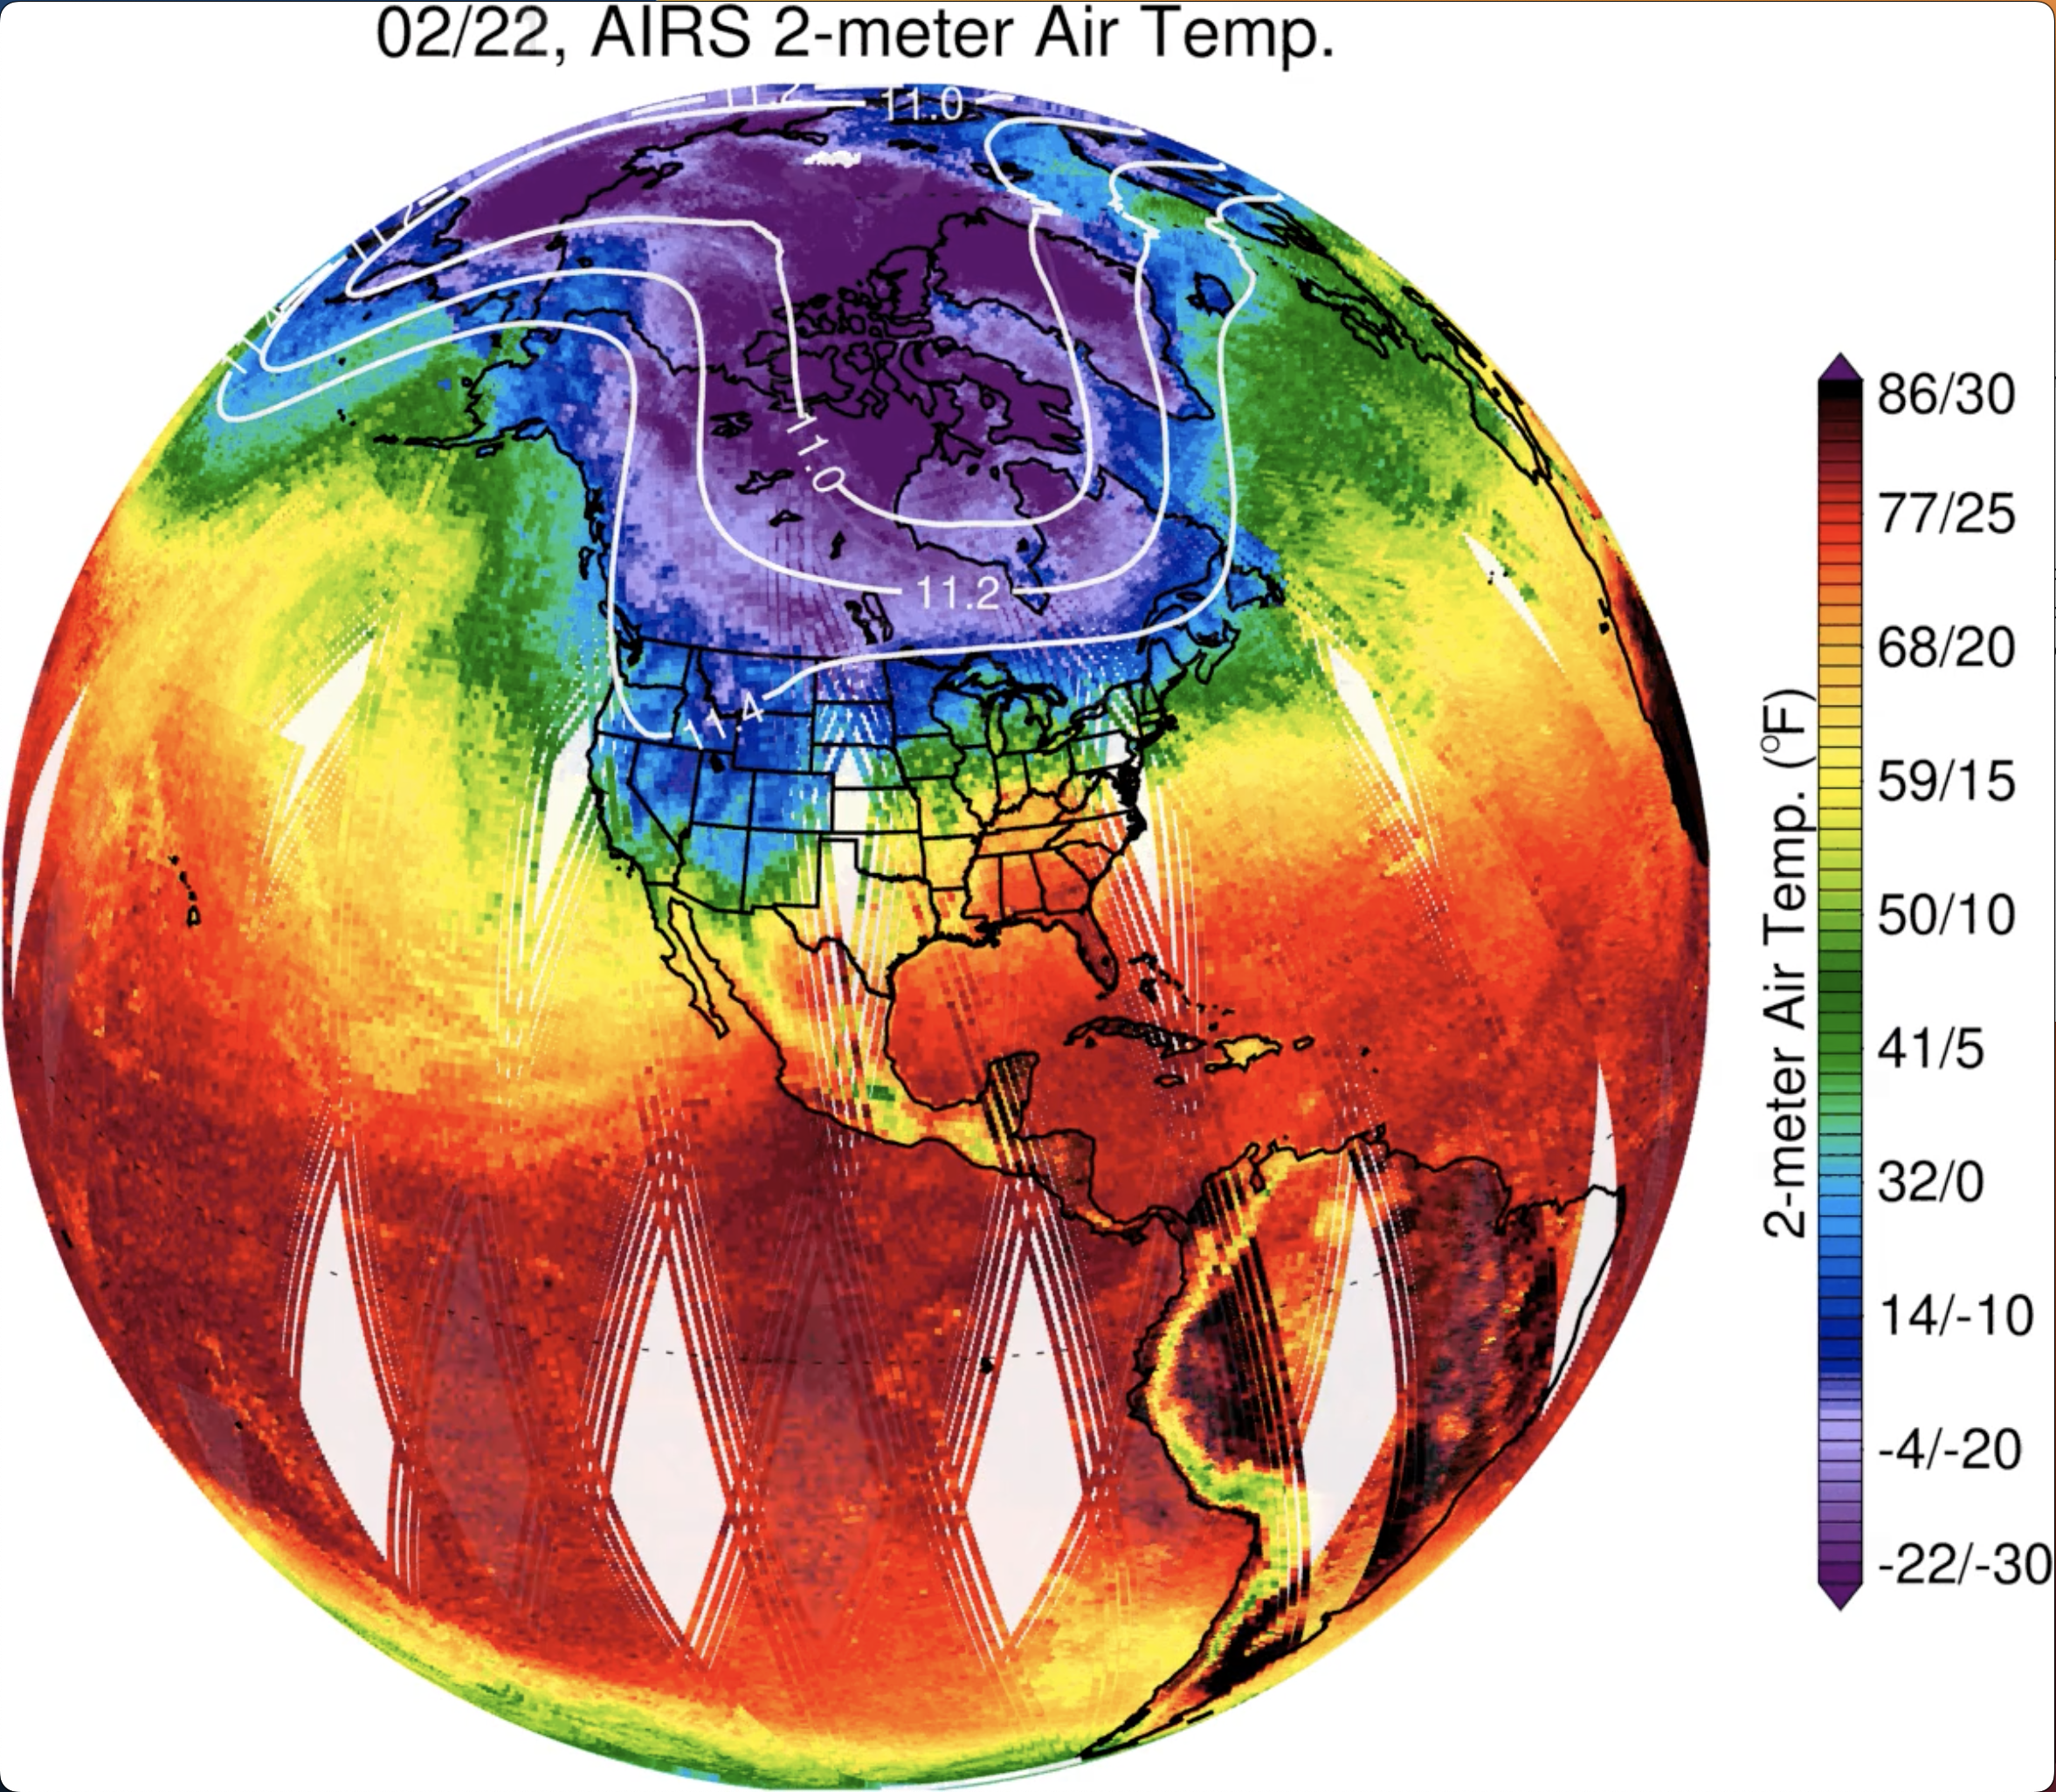
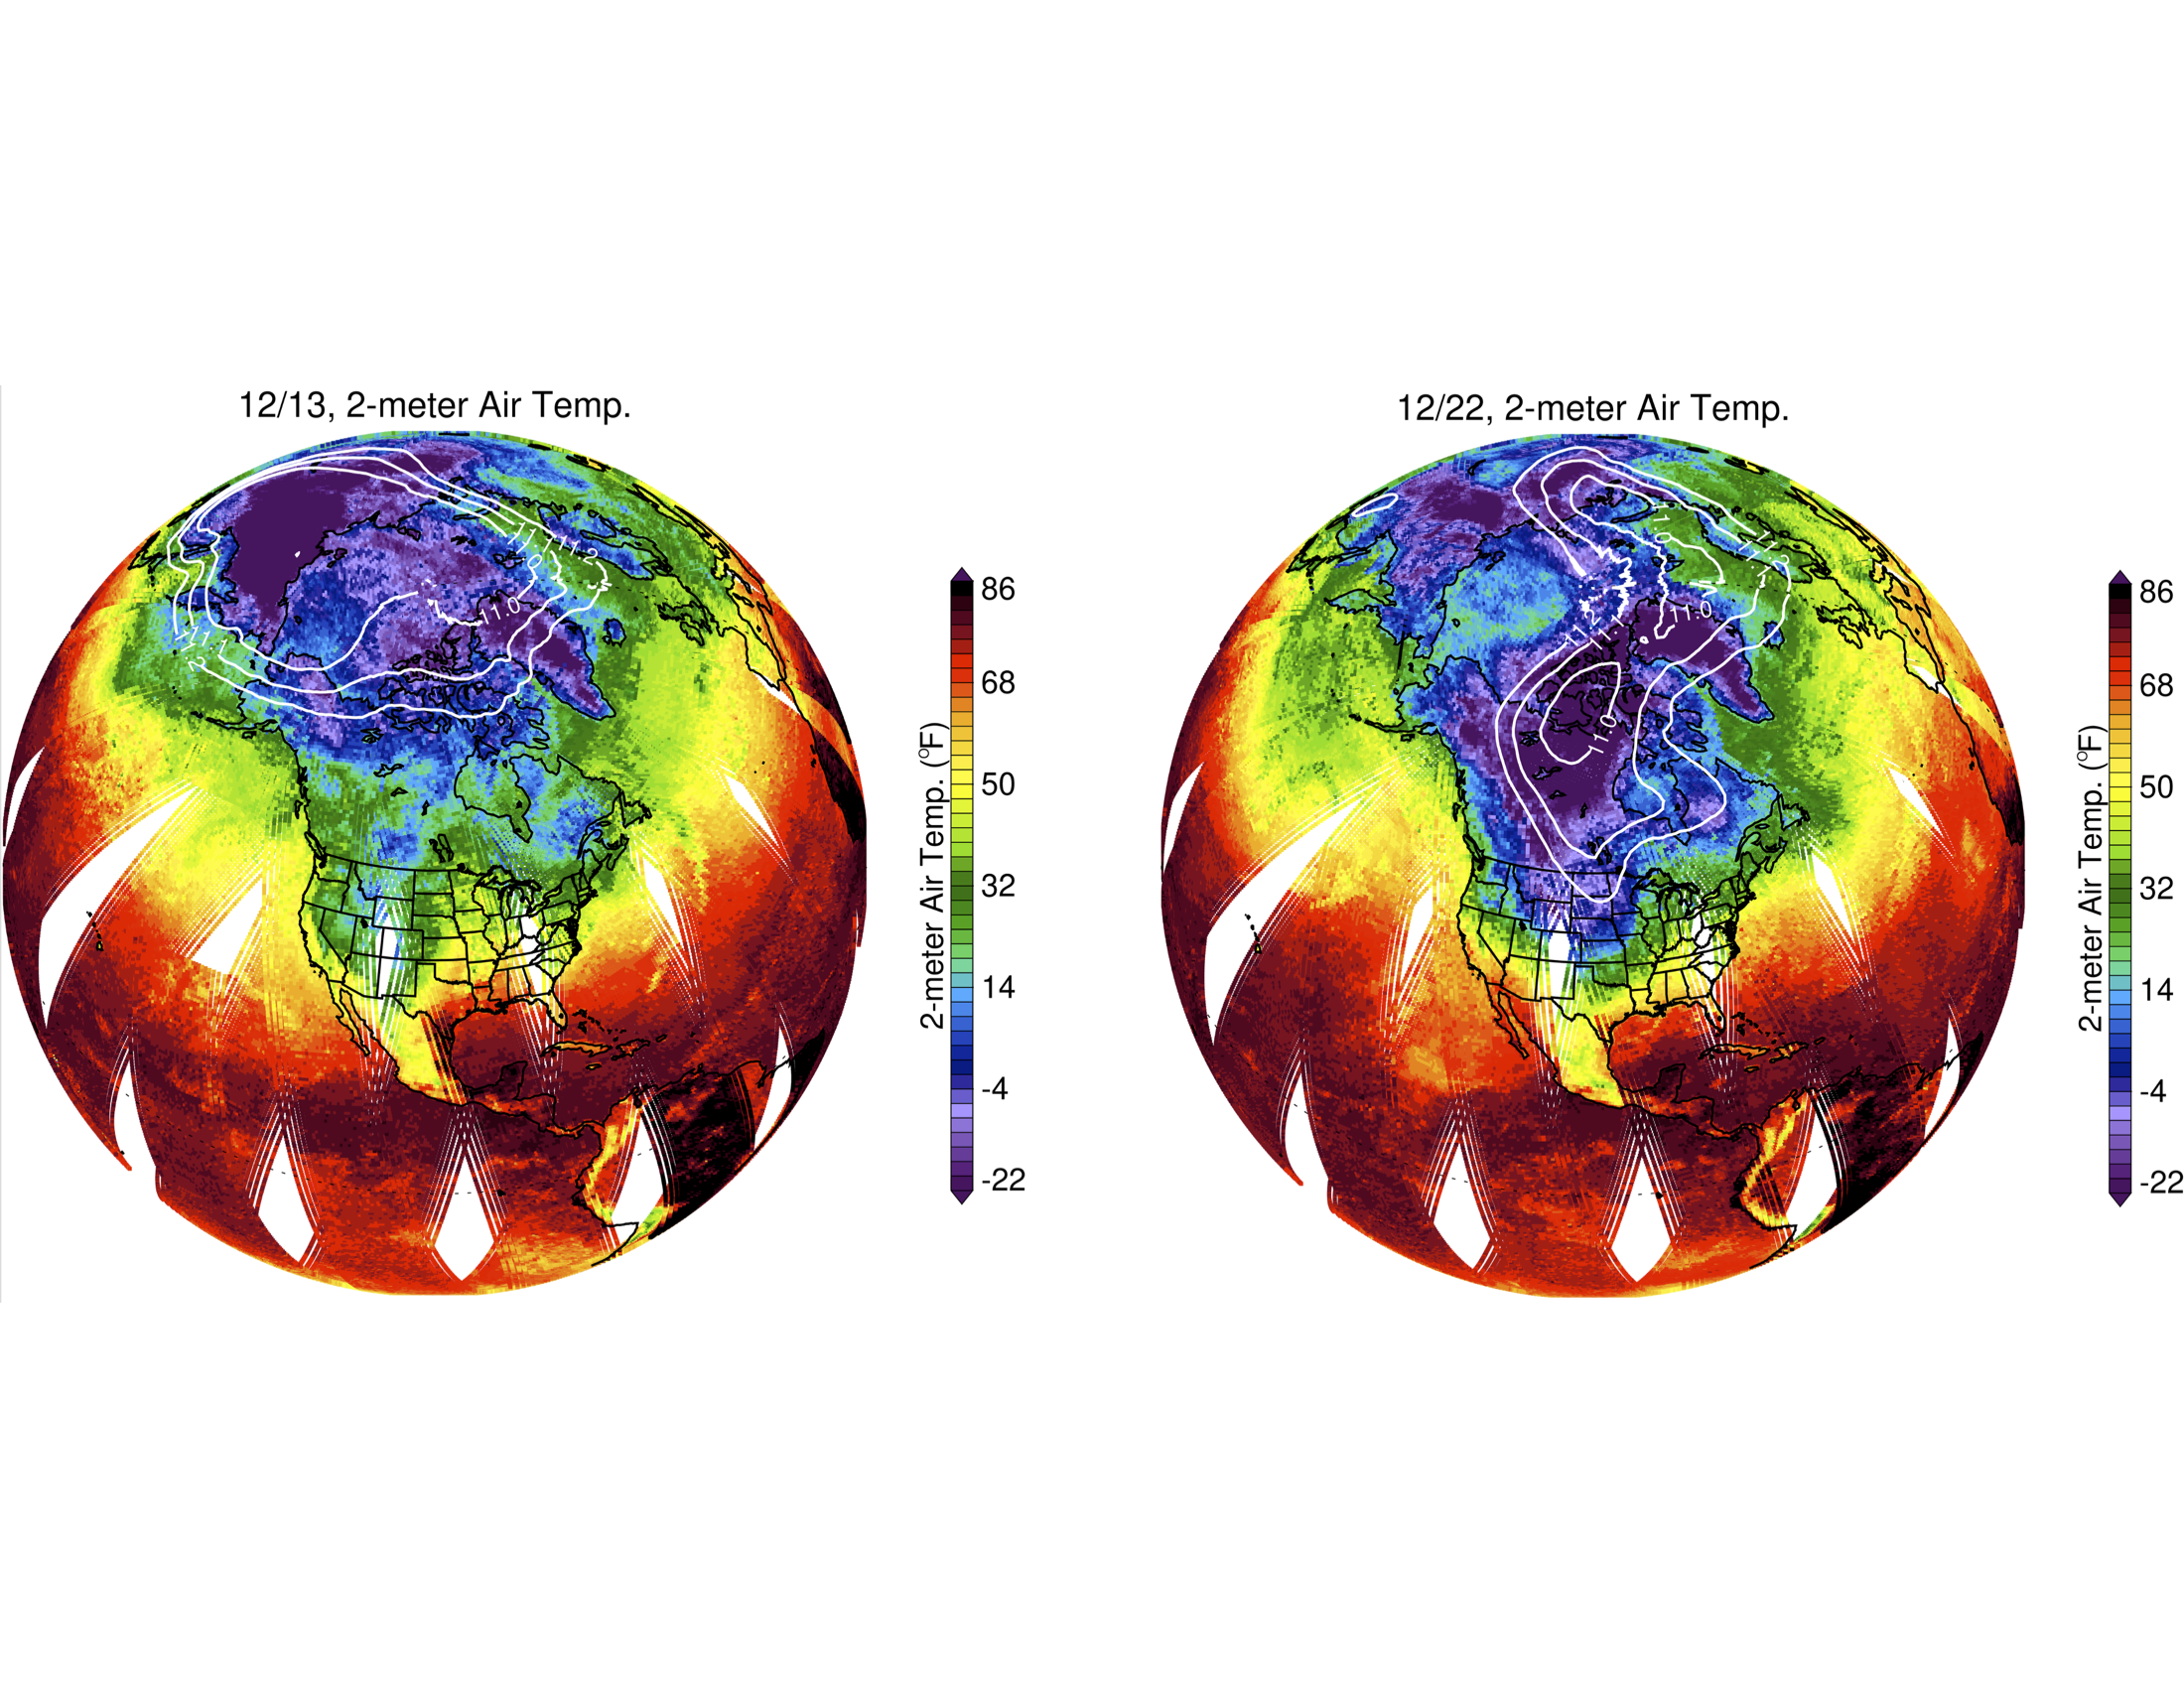
The Atmospheric Infrared Sounder (AIRS) instrument flying on NASA's Aqua satellite was one of the many tools the researchers used to find what they were looking for. With its ability to create three-dimensional maps of the atmosphere showing temperature, water vapor, and cloud properties, AIRS provides a unique view of the environment in which storms come to life. It served two roles in the GRIP experiment. The first was to help scientists decide when the aircraft would have the best chance of observing changes in a storm. The second, still on-going, is to help them as they interpret the results.
"We used AIRS data to help our understanding of the potential for storm development, which was a factor in our decisions on when to fly," said GRIP mission scientist Scott Braun of NASA's Goddard Space Flight Center. Each day, a forecast team evaluated ocean and atmospheric conditions to decide where best to look for a developing storm, and, when they did have a storm in view, anticipate where it might be headed or how its intensity might change. Advance planning was critical, since it could take several days to get aircraft and other resources in place.
"Timing is everything when it comes to trying to observe storm formation or rapid intensification. Getting this timing right includes fully understanding what is going on in the storm environment, and AIRS was useful for that purpose," Braun said.
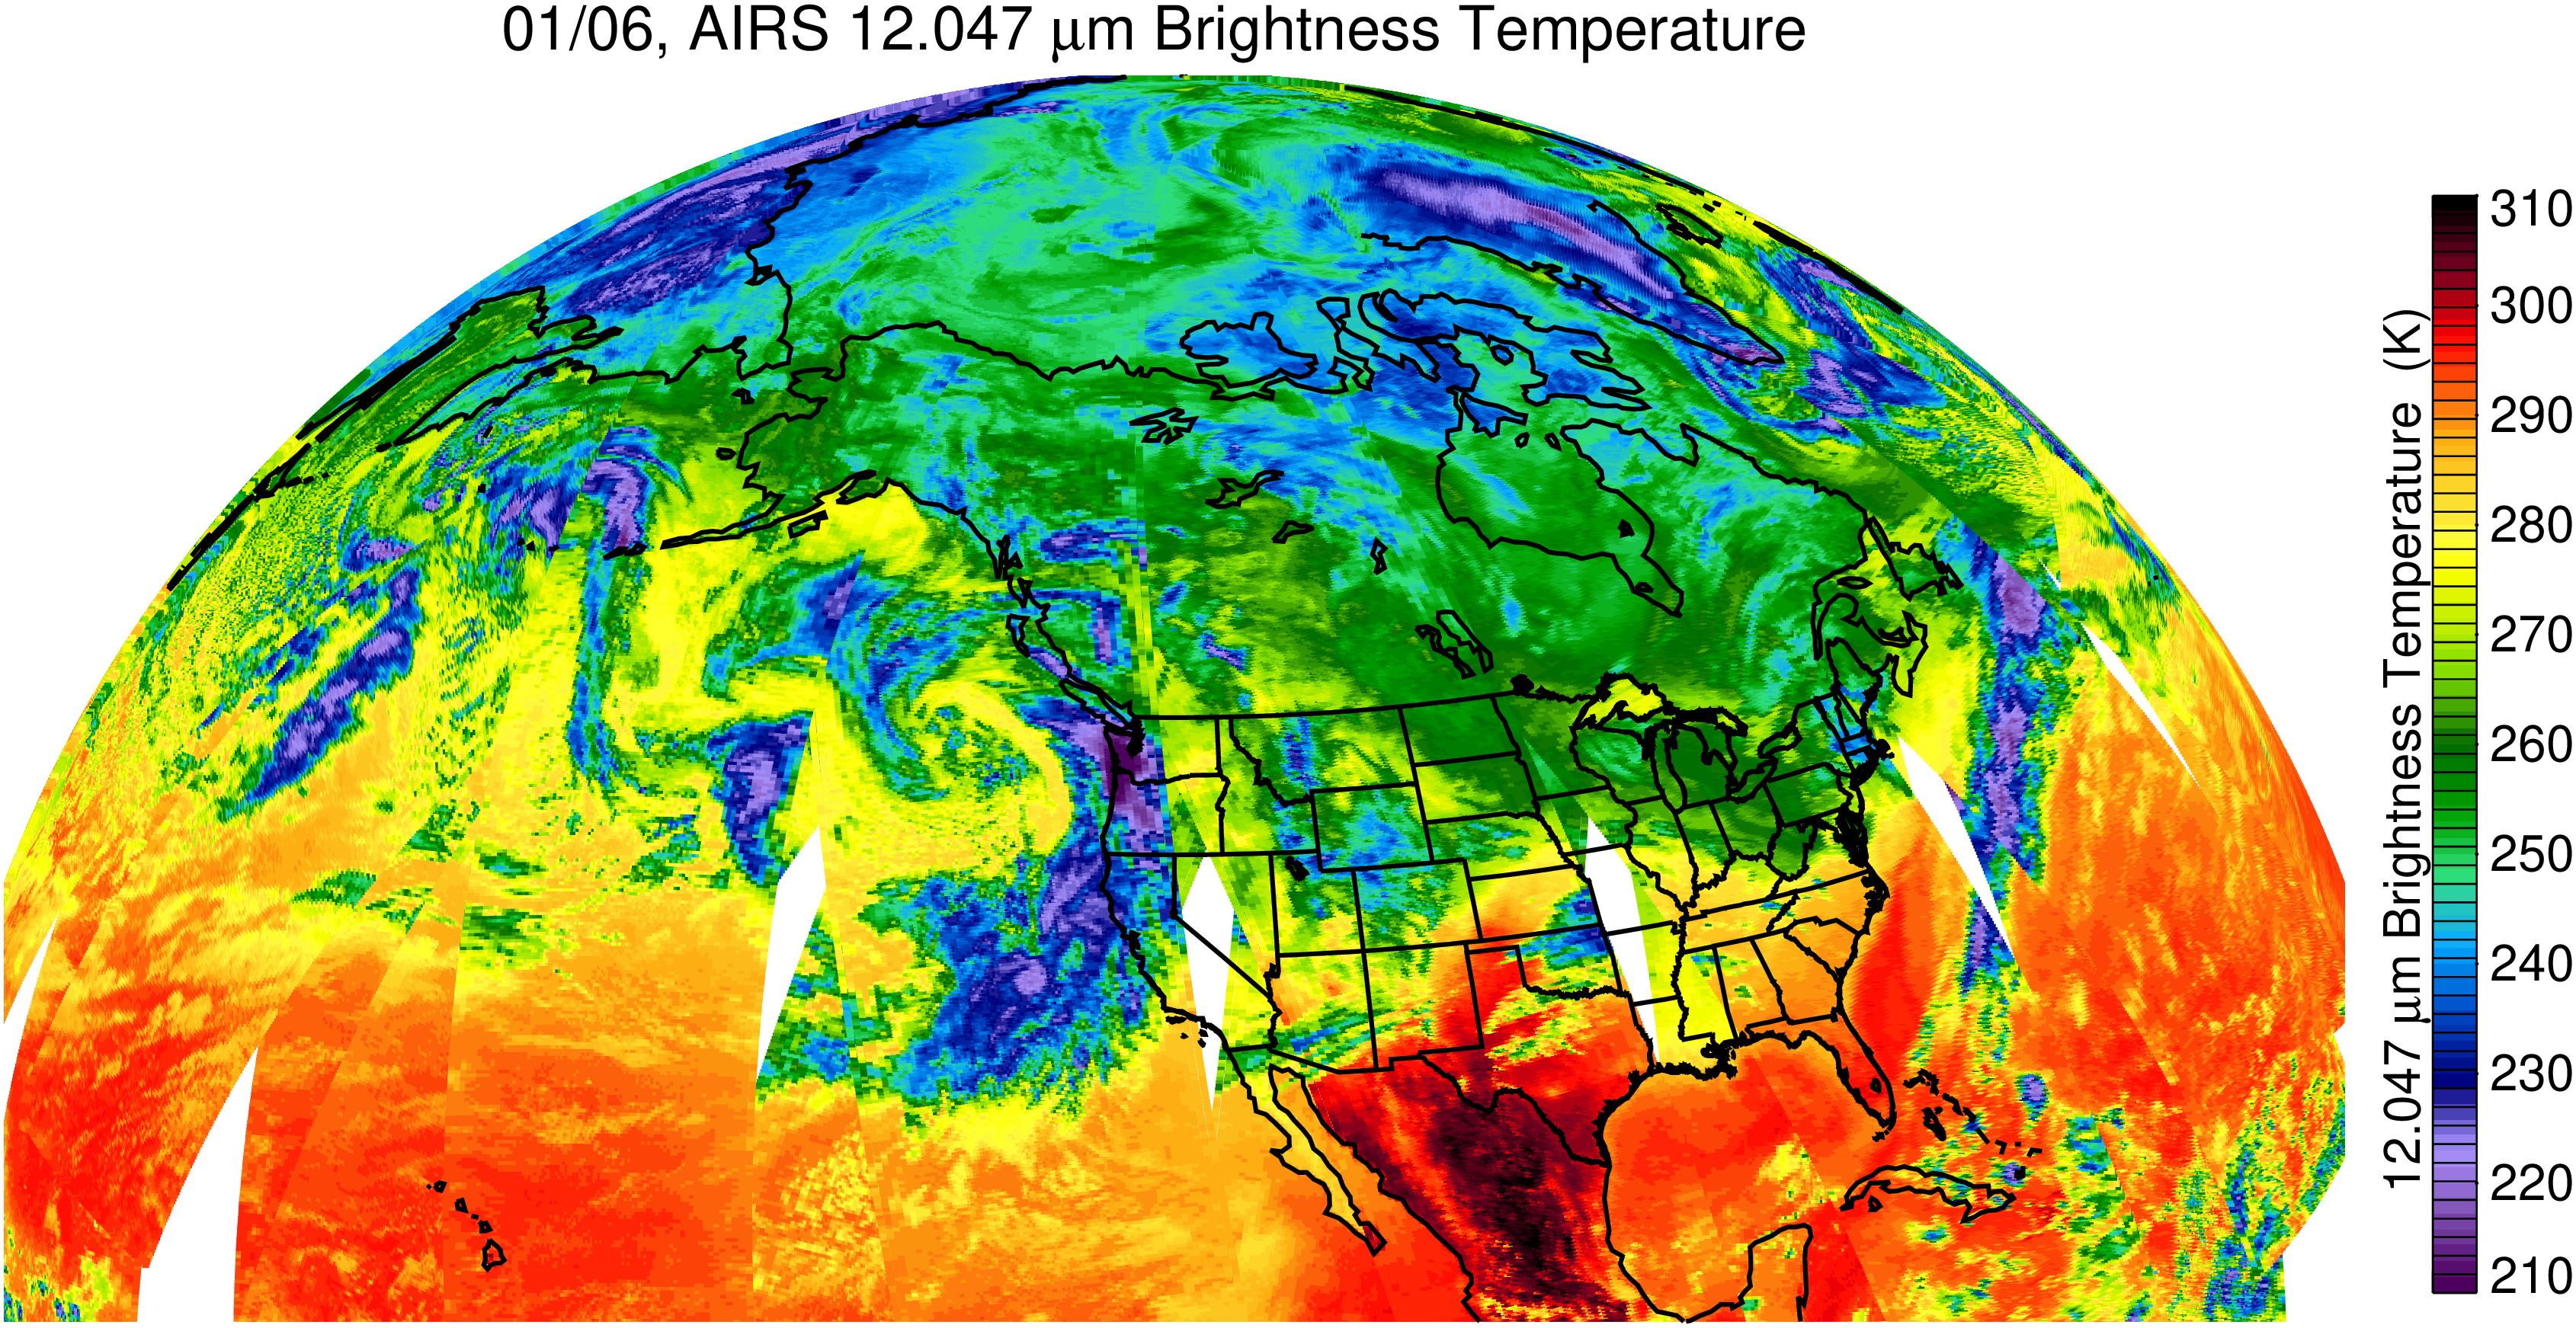
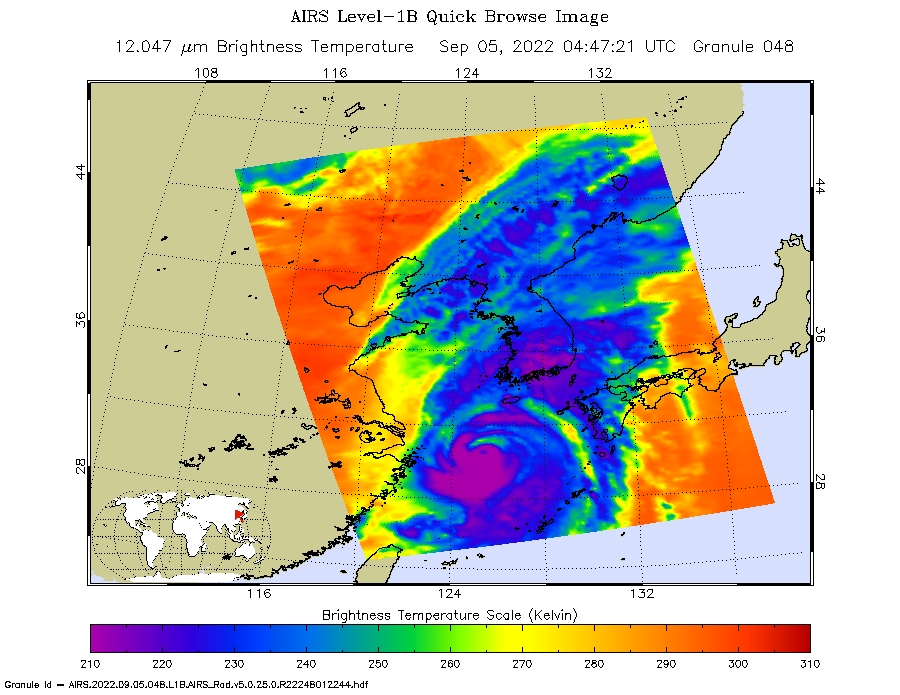
As it circles the globe, AIRS's surveys the atmosphere and surface below with more than 2,000 infrared detectors. Each senses a different wavelength, which is sensitive to temperature and water vapor at a particular height. By combining all these measurements, AIRS creates vertical temperature and moisture profiles of the atmosphere. While its infrared sensors cannot penetrate thick clouds, AIRS's microwave sensors can and provide information about the storm structure.
"With a tropical depression or hurricane, it is important to understand its environment," says JPL scientist Bjorn Lambrigtsen, a GRIP participant and the AIRS microwave instrument scientist.
In the Atlantic, cyclones often begin with a loose collection of thunderstorms moving east from the coast of Africa. "To try to figure out if one of these weather disturbances will turn into a cyclone, forecasters look to see if the minimum requirements are there for this to happen," said Lambrigtsen. "Two requirements are high sea surface temperature and high vorticity—that's when the clouds have already started to spin. Another is low wind shear—when the wind has little variation with altitude. All of those things are good for hurricanes."
Hurricanes also need a lot of moisture to grow. "Convection typically starts bubbling along at about 90 percent humidity, " Lambrigsten said. "If dry air gets into the system, it can snuff it out. AIRS tells us how much moisture is in the air and how it is distributed vertically in the atmosphere. Other sensors show only the total amount of water vapor in a column of air." During the GRIP campaign, forecasters looked specifically at AIRS data to see if there were layers of dry air around a storm and how they might impact a storm, he said.
Weather agencies around the world routinely use AIRS' data in their forecast models to improve their predictions. For hurricane researchers, AIRS is more than a forecasting tool. It is helping answer fundamental questions about which conditions contribute to hurricane development and which do not. One of these, for example, is the role that dry air plays in hurricane development--a mystery that AIRS may help solve as researchers begin analyzing GRIP results.
Winds frequently blow westward from the Sahara over the tropical Atlantic forming a layer of hot, dry and dusty air low in the atmosphere called the Saharan air layer. This air layer travels westward in the middle troposphere with an air current known as the African easterly jet. The jet is associated with waves of thunderstorms that sometimes result in tropical depressions and eventually hurricanes.
"Some people argue that the Saharan air layer has a negative effect on hurricane development, while others argue that it could amplify it," said Braun. On the negative side, the westward stream of hot dry air could help create wind shear—mowing off the tops of gathering storm clouds. The temperature difference between the hot Saharan air and the cooler, moist atmosphere below could shut down convection, the engine that drives hurricanes. On the other hand, Braun said, "It is possible that this jet is a source of energy and could increase a storm's activity."
AIRS three-dimensional profiles of the Saharan air layer combined with other satellite and GRIP aircraft observations of storms such as Earl, which quickly spun up to a category 4 hurricane despite the nearby presence of large amounts of dry air, may hold some answers.
With the success of GRIP, researchers are planning for the next major hurricane field effort scheduled to begin in 2012. "While there has been progress in hurricane prediction," says Braun, "we still do not fully understand what makes a storm get rapidly stronger or weaker." The Hurricane and Severe Storm Sentinel will be a five-year experiment to learn more about what causes a storm's intensity to change - whether it is something in the storm's environment or within the storm itself.
_______________________________________________
For More Information
SoCal Connected - Television show featuring story on the Grip Campaign
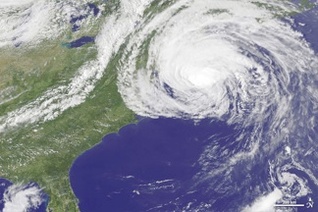 Hurricane Earl gave NASA scientists gave a perfect target for study. It rapidly grew to a category 4 hurricane and then fell to a category 1 in just one day.This GOES image shows the weakened storm on September 3, 2010, heading toward New England.
 GRIP mission scientist Scott Braun during the campaign.
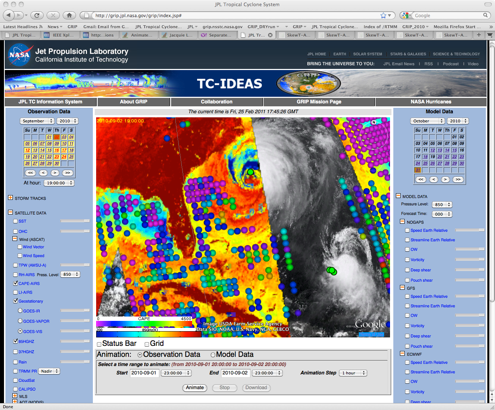 During the GRIP campaign, scientists used the JPL Tropical Cyclone-IDEAS websiteto see all the data being collected by airborne and satellite instruments and combine it indifferent ways. The window above shows the path of AIRS superimposed on a GOES satellite image hurricane Earl and Fiona on September 2, 2010. The colored dots link to AIRS measurements. The website, http://grip.jpl.nasa.gov/grip/index.jsp, continues to be an important tool for researchers and is also available to the public.
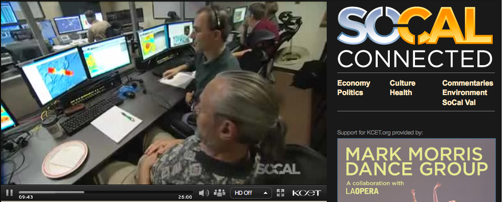 Los Angeles PBS station KCET featured the Global Hawk and GRIP campaign on the program SoCalConnected. Microwave instrument scientist Bjorn Lambrigtsen (left) in the control room at NASA's Dryden Flight Research Center.