The instrument on NASA’s Aqua Satellite has helped predict weather, and monitor trace gases, drought, volcanoes, and hints of flu.
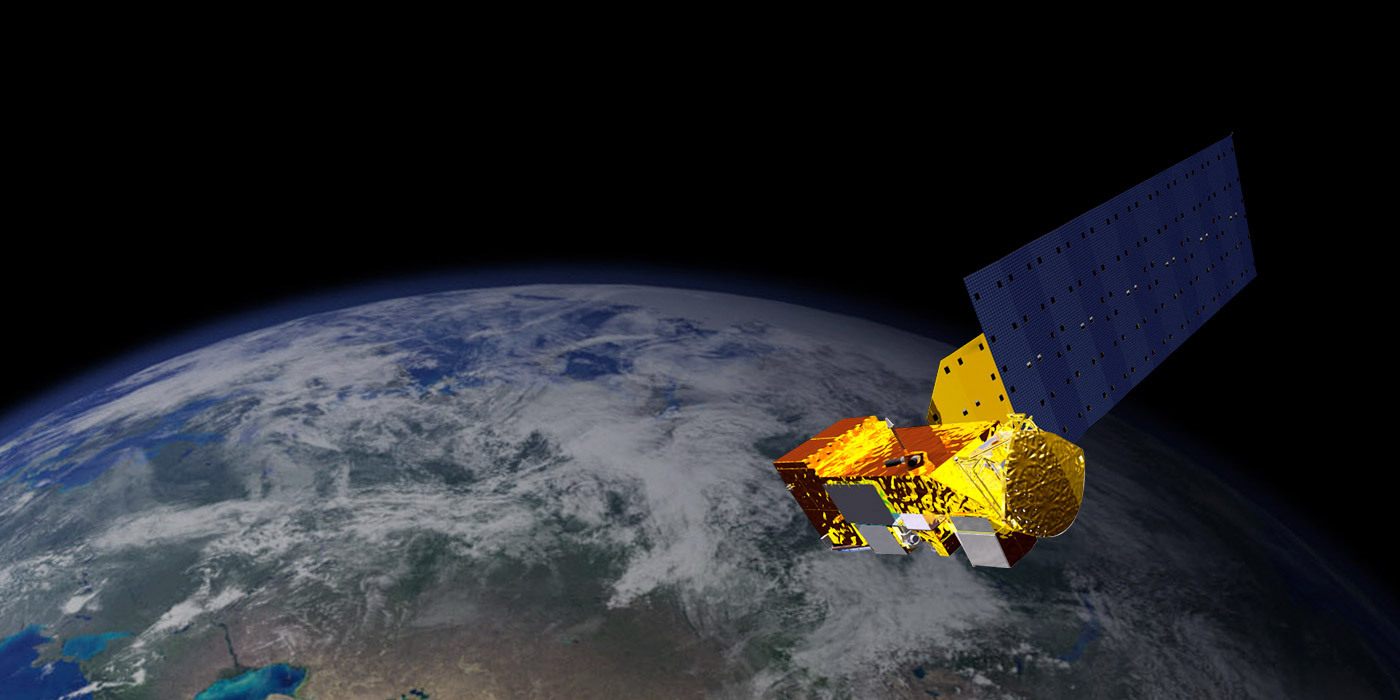
May marks the 20th anniversary of the launch of JPL’s Atmospheric Infrared Sounder (AIRS) aboard NASA’s Aqua satellite, on May 4, 2002. AIRS was the brainchild of the late Moustafa Chahine, once manager of JPL’s science division, who had the idea of improving weather forecasting through hyperspectral sounding back in the 1970s. Hyperspectral sounding uses thousands of infrared channels to better discern temperature and water vapor variations in the atmosphere. AIRS was selected for NASA’s Earth Observing System constellation in 1988.
As the first in a series of hyperspectral sounders for weather forecasting, AIRS was a trailblazer for understanding and assimilating hyperspectral data into weather forecast models. The new generation of European meteorological satellites now hosts a hyperspectral sounder, the Infrared Atmospheric Sounding Interferometer. A similar U.S. instrument called the Cross-track Infrared Sounder flies aboard the NASA satellite Suomi NPP and the next generation National Oceanic and Atmospheric Administration (NOAA) weather satellites.
Weather’s the Main Story
Weather forecasting is where AIRS had its greatest early impact. In 2006, a group led by the NOAA’s John Le Marshall showed that using AIRS data in weather forecasting models provided a significant improvement in forecast “skill.” Skill is the name of the calculation meteorologists use to quantify the closeness of a forecast to the observed weather. Ghassem Asrar, who was NASA’s Associate Administrator for Earth Science in the 2000s, says, “AIRS truly advanced the field of short-term weather prediction, but has also contributed to what is called now seasonal to sub-seasonal climate. We have learned more about internal variability of the Earth system and have used that knowledge to expand predictability across scales.”
During its first decade of operation, AIRS also scored some major scientific achievements. One was quantification of the water vapor feedback effect. A team led by Andrew Dessler of Texas A&M University tested the theory using AIRS’ humidity data product. AIRS could quantify the amount of water vapor at different levels of the atmosphere globally, permitting them to derive the average strength of the water vapor feedback across the globe. Dessler found that the water vapor feedback “is extraordinarily strong, capable of doubling the warming due to carbon dioxide alone.”
Trace Gases, and an Ammonia Bonus
Another achievement was development of data products that quantify various atmospheric trace gases, starting with carbon dioxide. AIRS’ ability to measure air temperature depends on its ability to detect carbon dioxide’s temperature at many different altitudes, so AIRS science team members had widely expected to be able to derive carbon dioxide’s concentration in the atmosphere from AIRS’ data, too. Chahine was ultimately able to produce the first global map of carbon dioxide in the mid-troposphere. While the relentless increase in carbon dioxide in Earth’s atmosphere was known from NOAA’s Mauna Loa observatory in Hawai’i, AIRS’ global view filled in some details.
One unanticipated result from efforts to make use of AIRS data for understanding trace gases in Earth’s atmosphere was demonstration of rapidly increasing ammonia concentrations in most of the world’s agricultural regions. Ammonia is released primarily by fertilizer and large-scale livestock operations. It’s very reactive with other gases and is involved in both the production of smog and particulate pollution. Ammonia is destroyed in these reactions, so any given molecule of ammonia stays in the atmosphere only a few days. Partly because ammonia is difficult to measure and partly because few countries regulate it, measurements of ammonia levels have been sparse, so global trends weren’t readily discernable.
A team led by Juying Warner of the University of Maryland, Baltimore County, set out to extract the signature of ammonia from AIRS data, hoping to identify global or regional trends over the instrument’s then 14-year lifespan. In 2016, they demonstrated steadily increasing levels of ammonia in Earth’s atmosphere, concentrated over four of the world’s major agricultural regions.
But the details were interesting. Even though fertilizer use in the United States had remained relatively constant over the period, ammonia had increased significantly. Warner’s team tied this to successful regulation and reduction of sulfur emissions from power plants, which had caused acid rain. The same sulfur products that were responsible for acid rain also removed ammonia, so their rapid reduction in the 2000s had the unintended consequence of increased ammonia concentrations. Essentially the same thing had happened in Europe and China. But in South Asia, where ammonia concentration was the highest, there was little trend despite rapidly expanding fertilizer use. The team argued this was likely due to rapid expansion of coal burning, without corresponding regulation of the resulting sulfur emissions.
Eric Fetzer of JPL, currently the AIRS project scientist, commented that while AIRS wasn’t designed to observe ammonia, “the unexpected large ammonia increase is one example of rapid atmospheric changes from human activities that AIRS is observing.”
Applying AIRS Science: Drought Monitoring
In AIRS’ second decade, Tom Pagano of JPL, the project manager, focused on expanding the range of uses for the team’s data. One initiative has been to bring AIRS data into NOAA’s aviation weather system, the Advanced Weather Interactive Processing System, so forecasters can use it more effectively.
One application the team pursued was drought monitoring. Typically, the U.S. warning of impending drought conditions has been done by monitoring precipitation. Meteorological drought--shortfalls of rain and snow--generally precede agricultural drought, defined by insufficient soil moisture. So the onset of agricultural drought can be predicted from the onset of meteorological drought.
But AIRS team member Stephanie Granger of JPL, who is also the group supervisor for applied science systems engineering, had read some work on monitoring early onset of drought from an index called vapor pressure deficit (VPD), which is calculated from temperature and relative humidity. “These teams were using ground-based sensors in the U.S. It occurred to me that we have these global observations of temperature and relative humidity. So, I put in a proposal to the AIRS project to produce the vapor pressure deficit anomaly as a drought product along with temperature and relative humidity anomalies. It turned out to be a pretty good idea.”
She and a small team used the VPD product to retrospectively monitor the onset of the 2012 drought in the U.S. High Plains region, which had been sudden and severe. The vapor pressure deficit provided more than a month’s lead time over the precipitation onset of the drought. They also examined the average statistics of all droughts between 2002 and 2014, and on average, the predictiveness of the vapor pressure deficit held up.
JPL’s Alireza Farahmand had also demonstrated the potential strength of AIRS relative humidity data to monitor drought onset before precipitation for up to 3 months in a 2015 paper. In his latest work, he looks at the development of four major historical droughts using satellite data. He showed that anomalously high VPD was largely responsible for the initiation of two of four case studies (2012 Midwest and 2011 Texas), and contributed to the development of one drought event (2006-2008 Southeastern). So AIRS’ global vapor pressure deficit product proves to be one useful tool for drought early monitoring among several.
AIRS Data, Volcanoes, and Airplanes
Another useful tool derives from AIRS’s dust and sulfur dioxide products, the Volcanic Plume Detection Rapid Response system developed at JPL. Clouds of volcanic ash are hazards to jet aircraft, as the ash can damage jet engines. The 2010 eruption of the Icelandic volcano Eyjafjallajökull dramatized the problem to the flying public by causing European authorities to essentially shut down air service for several weeks, but that volcanic ash could be hazardous to aviation had been known since at least the 1980s.
Ash, and dust, appear in AIRS data as contaminants, in a sense. Their presence in a scene could be misconstrued by an unwary weather forecaster as clouds, so the AIRS data production system provided error flags for scenes that might be contaminated with dust or ash. But it was hard to distinguish between dust and ash. However, use of sulfur dioxide, a gas produced by volcanos and power plants, could help determine whether a particular scene contained dust or volcanic ash. A scene with dust or ash but no sulfur dioxide would likely be dust, while a scene with dust or ash with sulfur dioxide would likely be volcanic ash.
Sulfur dioxide had first been measured from space by NASA’s Total Ozone Mapping Spectrometer in 1982. That instrument used ultraviolet measurements, but sulfur dioxide also has an infrared signature. A group at the University of Maryland first identified sulfur dioxide’s signature in AIRS data shortly after launch in 2002. Because sulfur dioxide’s infrared signature is weak and near that of water vapor, AIRS couldn’t detect it at lower altitudes, where most of the water vapor is. The sulfur dioxide signal is overwhelmed by the water. But that’s a benefit insofar as volcanic plume detection is concerned. Volcanoes can inject sulfur dioxide high enough for AIRS to detect it, while power plants at the surface generally cannot.
After the Eyjafjallajökull event, the European Space Agency funded development of a volcanic plume warning service, the Support to Aviation Control Service, which utilizes AIRS and other remote sensor data to provide automated warnings via email.
The JPL volcano team decided to make a public website that performed a similar function, the Volcanic Plume Detection Rapid Response page. The developer, Vince Realmuto, recalls that “our effort was mainly to put together, in a very high-information form on the websites, the tools to use the data. The idea was to produce a consumer-grade product that you didn’t need to be an expert to use.”
Tracking Hints of Flu Outbreaks
JPL’s Joao Teixeira, the AIRS science team leader, suggested another possible application to Heidar Thrastarson: use of AIRS specific humidity data to forecast flu outbreaks. There was already some literature noting that local flu outbreaks occurred during periods of lower humidity, though there was no agreement in that literature about which of the various suggested mechanisms would explain the link. There was also plenty of evidence of regional and even local variation in outbreaks.
In one recent effort, Thrastarson and some collaborators at JPL and the University of Southern California examined the variation in flu outbreaks and its dependence on average humidity among the 48 contiguous U.S. states. They found that each state has its own “threshold,” a point at which a flu outbreak became much more likely. There were some regional similarities, with states that have generally drier climates having thresholds at lower specific humidities than wetter states. But each had a different average threshold, and the year-to-year variations from those thresholds suggest that socioeconomic and/or other factors were at play beyond those played by climate, though these were not part of the study.
Thrastarson also forged a collaboration with the Los Angeles County Department of Public Health to build and validate a prediction model using AIRS data that’s still in progress. It was somewhat interrupted by the Covid-19 pandemic. “And then the pandemic came and there were a lot of personal behavior changes so flu temporarily vanished, especially last season. But while seasonal flu is expected to return, it’s also an opportunity to build on the system to possibly say something about Covid and other diseases,” Thrastarson commented.
Building confidence in their prediction models is another future project of Thrastarson’s group. “AIRS has very consistent data for past 20 years, so we can do long-term studies. We also have long-term flu surveillance data, so we can use these to do past forecasts for validation,” he says.
What’s Next for AIRS?
Future use of the AIRS data is a current topic. The Aqua satellite is expected to have sufficient power to operate into 2026, after which its climate-quality data record will end. But Vivienne Payne, AIRS’ atmospheric composition lead at JPL, believes there are “unrealized possibilities in integrating different wavelengths in the near and thermal infrared” that can be explored using the two decades of data already accumulated.
As part of NASA’s Earth Observing System, AIRS was also intended to develop a climate-quality record across the many wavelengths it senses. It has also proven to have unprecedented stability. This enables discernment of long-term trends from a single instrument’s data, avoiding the challenge of intercalibrating multiple instruments to remove biases and ensure consistency of the resulting data. Teixeira thinks that preserving and extending AIRS’ hyperspectral data record will be key to understanding ongoing but subtle changes to Earth’s atmosphere. “AIRS data has much more information in it than we are using,” he says.
With proper curation, that climate record will be available for future researchers to help expand our knowledge of humanity’s impact on Earth’s climate.
