News | October 8, 2008
A Brief History of Carbon Dioxide Measurements
JPL Historian Erik Conway provides an overview of the sequence of events that lead to the link between human activity, carbon dioxide, and global warming. Conway also examines how the spaceborne instrument, the Atmospheric Infrared Sounder, has become part of the story.
[[IMAGE||/system/internal_resources/details/original/92_GSCallendar1934.jpg||Left||232||GSCallendar1934||Guy Callendar in 1934. Photo from the University of East Anglia Archive (provided by James R. Fleming).||||300||]][[IMAGE||/system/internal_resources/details/original/93_shapeimage_1_1.jpg||Right||400||shapeimage_1_1||In his office in 1996, Charles Keeling points out the steady rise in carbon dioxide that came to be known as the Keeling Curve. Image courtesy of Scripps Institution of Oceanography||||300||]]During the 1950s, a small group of oceanographers and geochemists pursued a long-running argument over whether human industry was increasing the carbon dioxide content of the atmosphere. This mattered to the group for a couple of reasons. The oceans absorb carbon dioxide, making surface waters more acidic. In turn, the changing ocean chemistry would affect sea life.
They were also interested because carbon dioxide is a major 'greenhouse gas,' or GHG in current jargon. Like all of the GHGs (including water vapor, ozone, methane, and chlorofluorocarbons), it has the effect of slowing the radiation of Earth's heat out into space. If humans were increasing the amount of carbon dioxide in the atmosphere, we would be forcing the Earth to warm. A warming world would affect all life on Earth one way or another, making the issue of carbon dioxide a fascinating scientific question.
Guy S. Callendar, a British steam engineer and spectroscopist, had initiated this scientific argument with a pair of essays in 1939 and 1949 in which he argued that human activities had raised the carbon dioxide content of the atmosphere by about 10 percent since the beginning of the century. Roger Revelle, director of the Scripps Institution of Oceanography in La Jolla, California, and others believed that this couldn't be possible. The oceans and biosphere, this group thought, should have removed nearly all the anthropogenic excess.
Keeling and the Mauna Loa Experiment
Revelle was able to get funding to finally settle the dispute during the eighteen-month International Geophysical Year, 1957-1959. He hired Charles David Keeling, a new postdoctoral scientist, and sent him to the top of the extinct volcano Mauna Loa in Hawaii. They chose this remote, tropical location because it was upwind of any local industrial activity that might influence the measurement. Keeling made his measurements four times a day, every day, for the IGY's eighteen-month span.
Keeling's results were shocking. In addition to showing that carbon dioxide had increased significantly since the previous century, his measurements showed a clear upward trend just in the short eighteen-month IGY. Almost no one had expected that. Instead, the oceanographers who had been arguing over CO2 had believed that the oceans were absorbing most, if not all, of the CO2 emitted by humans. So if there was an increase at all, it would be very slow. Keeling's evidence, though, suggested that only half, or even less, of the CO2 humans released by burning fossil fuels and deforestation was being removed. So the increase was relatively rapid. Callendar had been right!
Other scientists replicated the Mauna Loa trend at other locations over the next decade. Still other scientists pursued measurements of methane, ozone, and chlorofluorocarbons. By the mid-1970s, they had demonstrated that all of these gases were increasing in the troposphere. There was no longer any question that humans were changing the chemistry of the atmosphere.
The question became, 'How much will Earth warm?'
Most research during the next fifteen years focused on the question of how severe the human-induced warming would be. In 1989, however, the United States established the U.S. Global Change Research Program, which specifically required research into ways to reduce the greenhouse-gas induced warming. In practice, this meant finding ways to reduce emissions of these gases, identifying where, specifically, greenhouse gases were emitted from ('sources') and removed from ('sinks') the atmosphere and ways of monitoring emission sources.
Identification and monitoring of sources and sinks, however, is actually quite difficult. The measurements taken to prove that greenhouse gases were increasing globally had deliberately been made far away from obvious sources so the measurements wouldn't be contaminated. And for political, legal, and economic reasons, one can't establish measuring stations near all of the thousands of sources. Remote sensing was an obvious solution to the identification and monitoring problem.
The Atmospheric Infrared Sounder and CO2 Measurements
Monitoring of trace gases wasn't the AIRS instrument's original purpose, though. In the late 1960s, JPL's Moustafa Chahine had developed a method for extracting temperature measurements of the atmosphere from the infrared radiance of atmospheric carbon dioxide. Initially used to take the temperature of Jupiter, a gas giant, it could also be used to generate temperature profiles of Earth's atmosphere. Weather forecast models used temperature profiles from balloons launched around the world twice per day to make weather predictions, but their value was limited by the fact that they weren't launched over the oceans or the polar regions, both important sources of weather. A satellite instrument could measure these regions as well.
Chahine was ambitious, and wanted to build an instrument that would rival the vertical resolution of the weather balloons. That required being able to measure very small differences in the frequency of the infrared radiation being received by the instrument'a trait known as 'spectral resolution' in remote sensing. He was able to get a grant to experiment with a 20 channel, airplane-based spectrometer in 1975, but then the idea languished. It was revived when NASA started funding technology development for its Earth Observing System in the mid-1980s.
Started in 1987, AIRS development lasted until the Aqua satellite was launched in May 2002. Chahine, who was JPL's chief scientist during much of this period, had hired George Aumann on as the project scientist. Aumann, in turn, had built up a project science team oriented towards calibration and validation of the instrument and its primary mission products, meteorological parameters like temperature and humidity. But the inherent stability of the AIRS instrument, designed by BAE Systems of Lexington, Massachusetts, combined with the simple, accurate calibration developed by Aumann and his team laid the foundation for success of Chahine's algorithms.
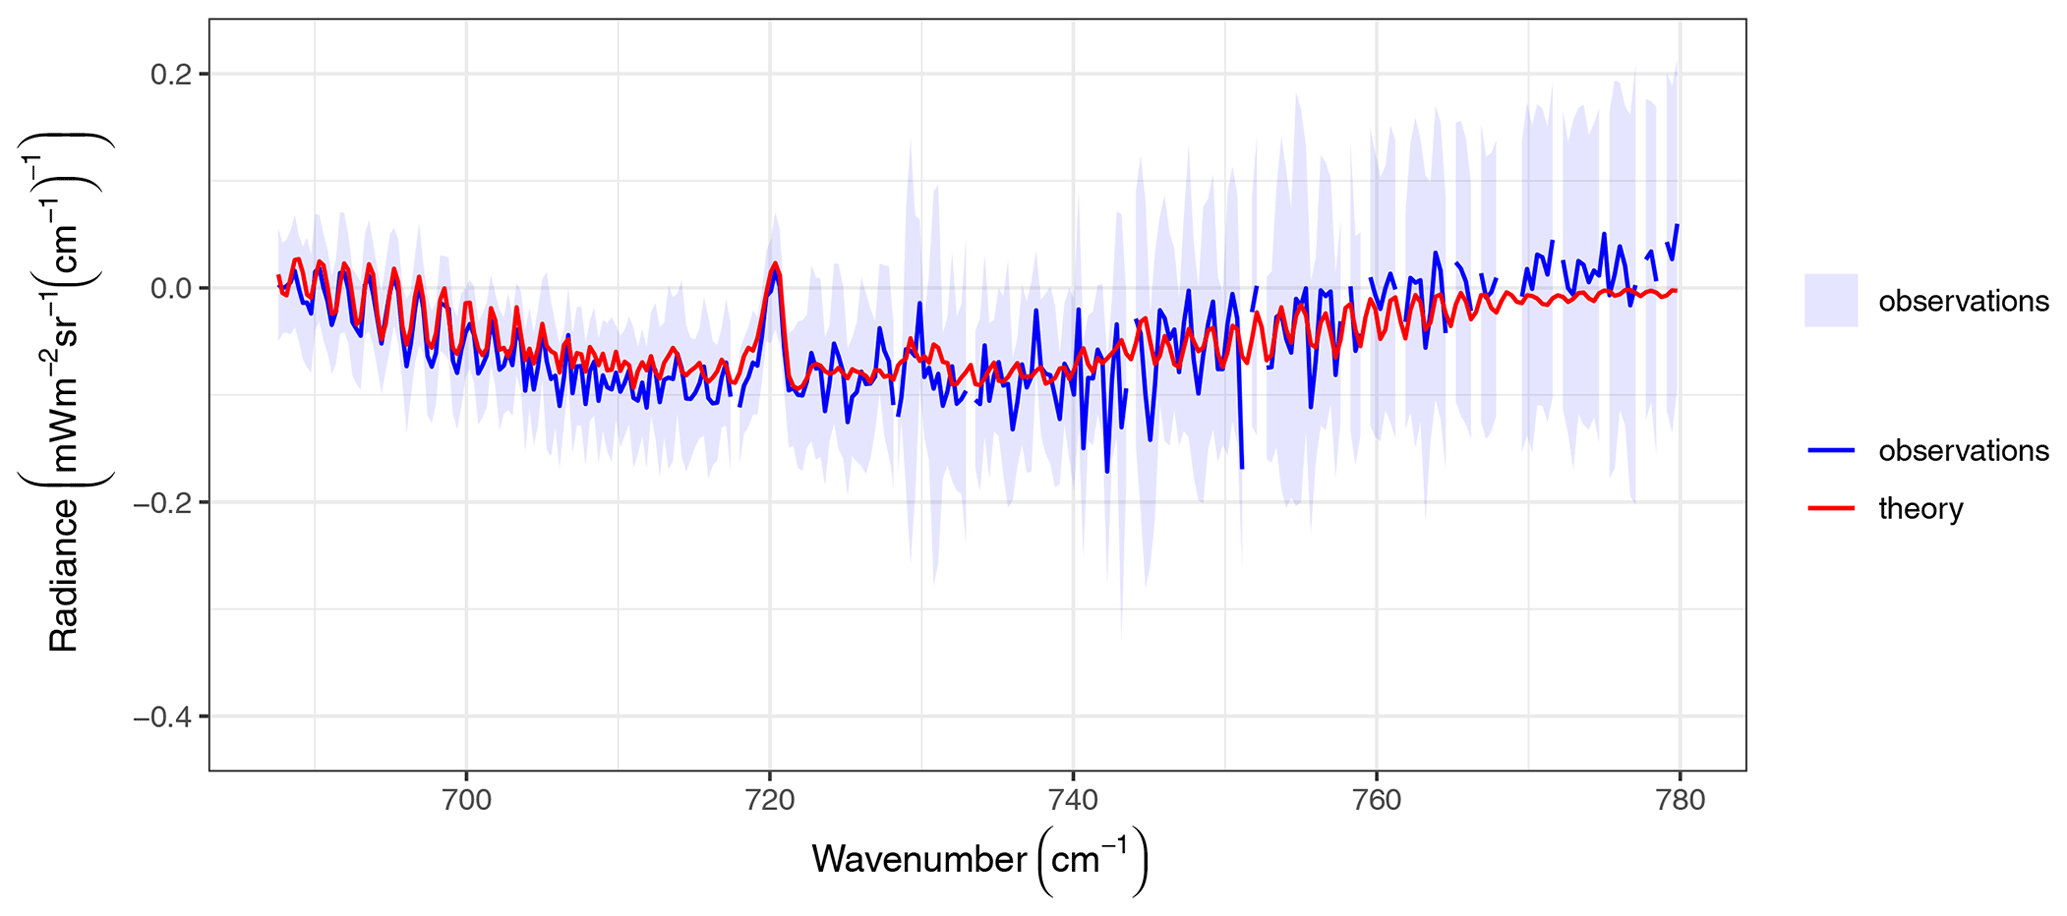
By 2004, Chahine and Aumann were satisfied that they'd met their primary meteorological goals and had started to look at other information that might be drawn from AIRS' spectra. Long-time team member Larrabee Strow, an infrared spectroscopist at the University of Maryland, reflected at the March science meeting that he'd always assumed that he'd be able to obtain trace gas concentrations from the AIRS spectra. Carbon dioxide is one gas represented in AIRS data, and the challenge was to find a way of removing contamination of the carbon dioxide signal by other trace gases in the atmosphere.
Other scientists looking at AIRS data drew on information that was outside of the satellite instrument to remove the effects of other gases, but Chahine really wanted the retrieval to use only observational AIRS data. Retrieval of the carbon dioxide mixing ratio is complicated by the temperature signal generated by carbon dioxide as well as by the signatures of ozone and water vapor. Chahine and his team, including Chris Barnet and Eric Maddy of NOAA, Larrabee Strow of UMBC, and George Aumann, Ed Olsen and Luke Chen of JPL, used a technique called 'vanishing partial derivatives', which involves freshman algebra to retrieve CO2 without any outside information, to remove the signatures of the other trace gases. Although AIRS isn't able to measure CO2 near the surface, where the carbon sources and sinks are located, Chahine successfully measured CO2 in the mid troposphere, about 10 km above the surface. Measurements at this altitude are actually more important at this time because they show the global mixing and transport of CO2.
Now that Chahine and his team were able to measure CO2 they needed a way of validating their results. Although a wealth of independent measurements of CO2 are made at the surface, there are very few data sets made in the mid troposphere. Luckily for the AIRS team, a Japanese group had been measuring mid-tropospheric carbon dioxide from airliners flying between Japan and Australia at just the right altitude. Comparisons showed the AIRS data tracked the monotonic increase in carbon dioxide seen in the Matsueda data over two years of AIRS operation, as well as revealing the sawtooth pattern of seasonal variation first seen in Keeling's data during the IGY. Success! Now the AIRS data can be used as the 'truth' in the middle troposphere when validating carbon cycle models.
What's next?
Eventually, carbon cycle models will need 'truth' data sets for validating their results near the earth's surface, in the boundary layer. When direct observations of boundary layer CO2 are available, decision makers can also use this information directly. During the late 1990s, Chahine had started a lunchtime 'carbon club' to discuss possible ways of measuring CO2 in the boundary layer. Out of those discussions eventually emerged the Orbiting Carbon Observatory, a new small satellite being readied for launch in 2009. It will fly in formation with Aqua, providing total column of CO2 with good sensitivity near the surface. When used in the context of the mid-troposphere measurements produced by AIRS on Aqua, it will give scientists a complete picture of CO2 sources and sinks, helping them understand how levels of the gas will evolve in the future.
-
•In 1939, Guy Callendar argued that human activities had raised the carbon dioxide content of the atmosphere by about 10 percent since the beginning of the century.
-
•Keeling's measurements on Mauna Loa in the late 1950's showed a clear upward trend in the amount of CO2 in a short 18-month period
-
•In the late 1960s, Moustafa Chahine developed a method for extracting temperature measurements of the atmosphere from the infrared radiance of atmospheric carbon dioxide
-
•In 1989, the United States established the Global Change Research Program to study ways to reduce greenhouse gas induced warming
-
•In 2002, the Atmospheric Infrared Sounder, a spaceborne instrument first proposed by Chahine in 1987 to study weather and climate, launches into Earth orbit aboard NASA's Aqua spacecraft
-
•In 2004, infrared spectroscopist Larrabee Strow confirms the AIRS instrument can measure CO2 concentrations
-
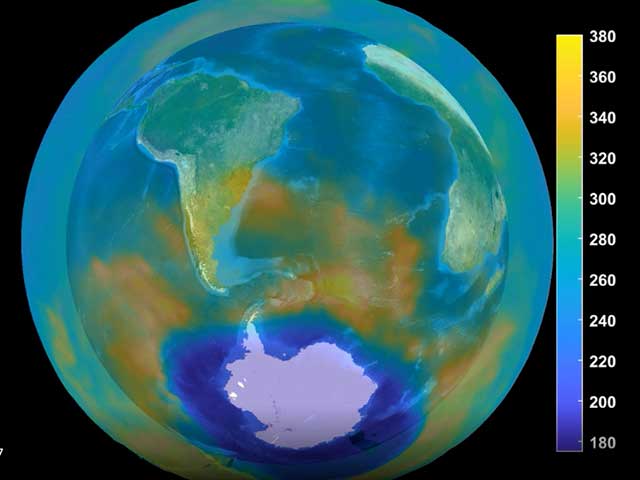
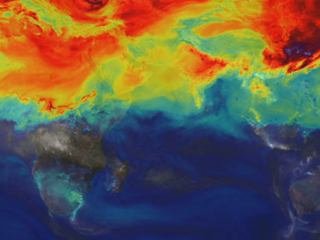
•AIRS successfully measures CO2 in the mid-troposphere where the global mixing and transport of CO2 are known to occur. AIRS also creates the first global snapshot of CO2 from direct observation
-
•The Orbiting Carbon Observatory will launch in early 2009 and provide a new window on CO2. By combining AIRS and OCO data, scientists will be able to create a complete picture of CO2 sources and sinks
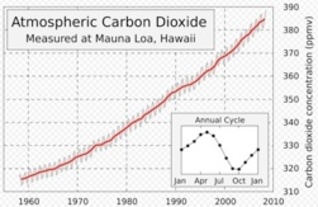 The 'Keeling Curve', showing the measured rise in the concentration of CO2 over time Credit: Wikipedia
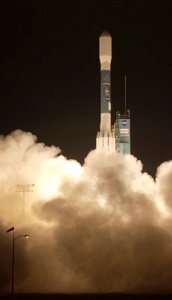 AIRS launches aboard Aqua in 2002
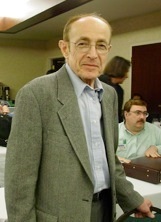 Moustafa Chahine
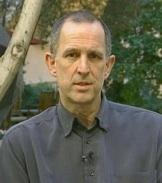 Larrabee Strow
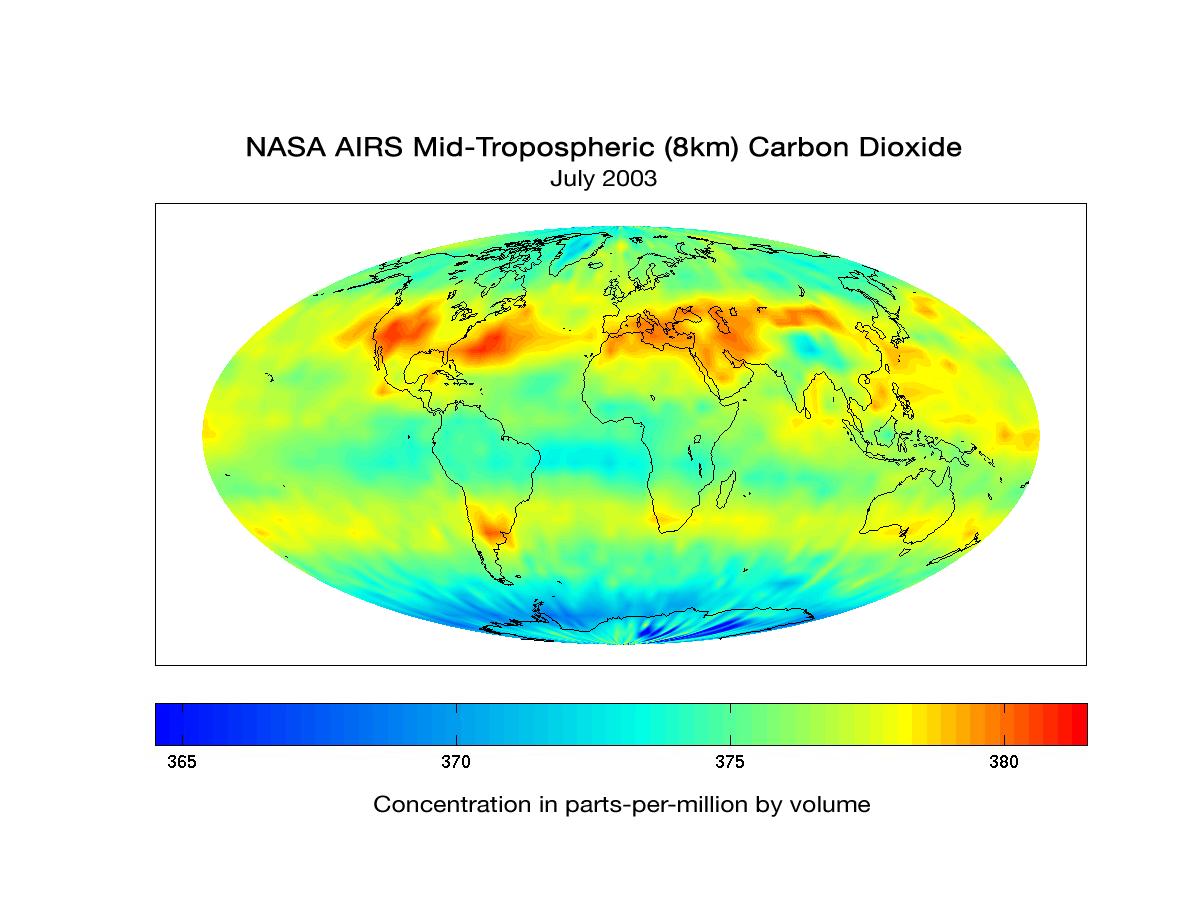
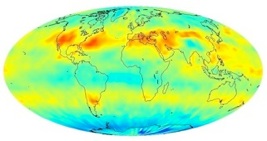 Global CO2 concentration, July 2003
View image
