News | November 19, 2009
Using AIRS Data with ArcGIS - Helpful Videos
Geographic Information Systems (GIS) are computer applications that incorporate geographical features with tabular data in order to map and analyze real-world problems. ArcGIS is a system introduced by a company called Environmental Systems Research Institute, Inc. (ESRI) to meet the needs of a wide range of GIS users.
On the blog titled 'GIS and Science' maintained by the GIS and Science Program Manager for ESRI, a number of 'how-to' videos are outlined that detail using AIRS data with ESRI GIS tools. The tools are developed on top of ESRI's ArcGIS suite of GIS products utilizing ArcObjects.
These videos demonstrates a component of a series of tools developed by the Redlands Institute at the University of Redlands, CA as part of a collaborative project with JPL to download, visualize, and analyze source AIRS satellite sounder data.
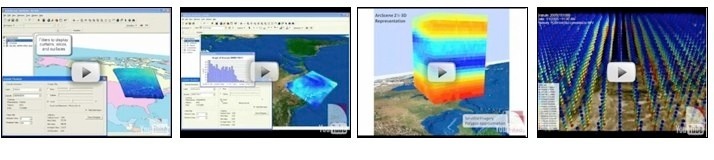
Videos include:
- The Data Loader Component.
This component allows the user to select a phenomenon, date range, and geographic extent to download. The tool then interprets this query, finds the matching data files on an ftp site and downloads them. Once downloaded the HDF formatted data is processed and converted for display and analysis in ArcGIS.
- The ArcScene version of the Visualizer Component.
- The AIRS Granule Data Loader and Visualizer
Developed by The Redlands Institute in collaboration with JPL.
- Sample outputs created by the AIRS Granule Data Loader and Visualizer.
GIS and Science
A helpful set of videos covering how to use AIRS data with ArcGIS tools
Visualization and Analysis of Atmospheric Infrared SounderSatellite Sounder Data
