NASA
Jet Propulsion Laboratory California Institute of Technology
Skip Navigation
AIRS
Stay Connected
menu close modal
Multimedia

Imagery for Digital Globes

digital globe map of polar vortex
Published: August 1, 2019

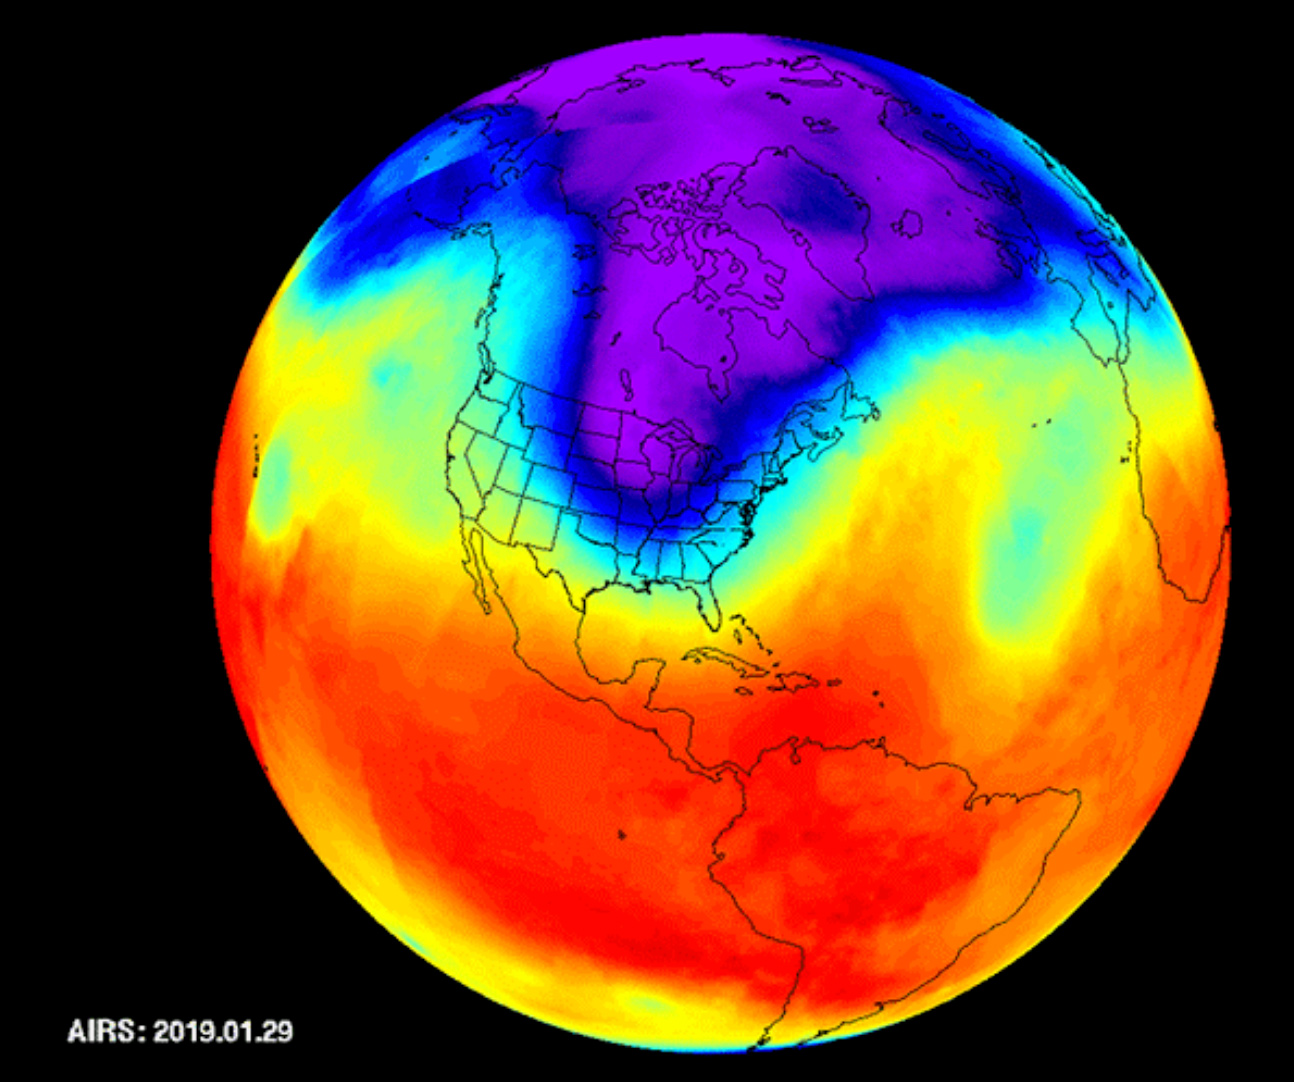
POLAR VORTEX, JANUARY 2019

See time series and caption

https://climate.nasa.gov/news/2839/nasas-airs-captures-polar-vortex-moving-in-over-us/

Download images

Download each image to create a time series.
Each image is 3600x1800 pixels in cylindrical projection.

ENLARGE

Downloads

Imagery for Digital Globes
38.8 MB
application/zip
Download

More Like This

  • Globes
  • Polar Vortex

Related

Interactive globes showing the 20-year surface air temperature trend from AIRS daytime and nighttime observations.
More
Interactive globes showing the 20-year surface air temperature trend from AIRS daytime and nighttime observations.
Interactive Surface Air Temperature Trend Globes
AIRS Level 3 Daily Temperatures at 500 mb for January, February and March 2019. Ascending and Descending orbits are averaged.
More
Air Temperature at 500 hPa
Polar Vortex – Air Temperature at 500 hPa, January-March 2019
This movie of temperature observations from NASA's Atmospheric Infrared Sounder (AIRS) instrument on NASA's Aqua spacecraft depicts the first major North American weather event of 2014: cold air mo...
More
NASA's AIRS Sees Polar Vortex Behind U.S. Big Chill (narrated)
This movie of temperature observations from NASA's Atmospheric Infrared Sounder (AIRS) instrument on NASA's Aqua spacecraft depicts the first major North American weather event of 2014: cold air mo...
More
NASA's AIRS Sees Polar Vortex Behind U.S. Big Chill
Interactive globes showing the 20-year trend for total column water vapor from AIRS daytime and nighttime observations.
More
Interactive globes showing the 20-year trend for total column water vapor from AIRS daytime and nighttime observations.
Total Column Water Vapor Trend - Interactive Globes
As the polar vortex rotates you see consistent patterns over the United States, where the tongue of cold air will dip repeatedly over and over bringing wave after wave of bad weather.
More
Globes showing polar vortex time series.
Polar Vortex mosaic animation, December 2002 to March 2020
Animation showing surface air temperature maps with geopotential height contours (in km at the 200 hPa pressure surface) overlaid over North America and the Arctic from February 17th to 26th, 2023,...
More
Animation of surface air temperature and geopotential height during February 2023 cold outbreak over US
During the month of January 2014, the continental United States experienced several bouts of extremely cold air that moved southward from the north polar region.
More
Temperature Anomaly corresponding to January 2014 Polar Vortex Activity
more resources

News & Features

Cold California weather after polar vortex breakdown captured by AIRS
More
February Cold in California as Captured by AIRS
Atmospheric River Storms hitting the US West Coast shown with AIRS brightness temperature data
More
California Atmospheric River Storms Captured by NASA's AIRS
Surface air temperature maps with geopotential height contours overlaid over North America and the Arctic on December 13th and 22nd, 2022, showing the breaking polar vortex and extremely cold air plunging into the US.
More
AIRS Captures Extreme Cold Air Outbreak Sweeping Across North America
Sulfur dioxide plume from Mauna Loa volcanic eruption
More
NASA's AIRS Instrument Tracks Volcanic Sulfur Dioxide Plume from Mauna Loa to Texas over Three Days
The Atmospheric Infrared Sounder aboard the Aqua satellite captured the outer bands of the powerful tropical cyclone as the storm approached the Korean Peninsula.
More
NASA's AIRS Instrument Records Typhoon Hinnamnor Before Landfall
The visualizations and images in this story show several quantities AIRS has observed over its 20 year lifetime. Most of these quantities have a common trait: the effects over the past two decades of human activities are easily seen in the AIRS observations.
More
20 Years of AIRS: A Story in Visualizations
All News

Stay Connected

Home

Sounding Science

    • Overview
    • What is Sounding?
    • Weather
    • Climate
    • Composition
    • Significant Findings
    • Publications
    • Sounding Science at JPL

Mission

    • Overview
    • Science Objectives
    • AIRS Project Instrument Suite
    • Instrument Operations
    • People

Data

    • About the Data
    • About the Products
    • Get Data
    • User Guides & Documentation
    • Validation
    • Outages
    • Readers & Tools
    • View Data
    • Support

Applications

    • Health
    • Volcano
    • Drought
    • Wildfire
    • Weather

Multimedia

Science Meetings

    • Science Team Meetings
    • Sounder Discipline Monthly Telecons
  • Feedback
  • |
  • Ask AIRS
  • |
  • Privacy
  • |
  • News

Site manager and webmaster: Sharon Ray