News | October 8, 2008
AIRS and Carbon Dioxide: From Measurement to Science
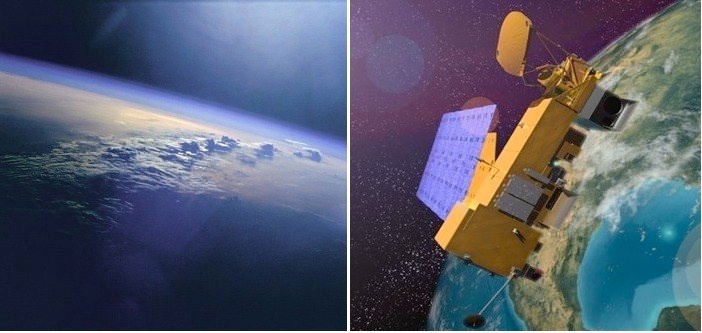
(left) Clouds and sunglint during Space Shuttle STS-96 mission. Image credit: NASA
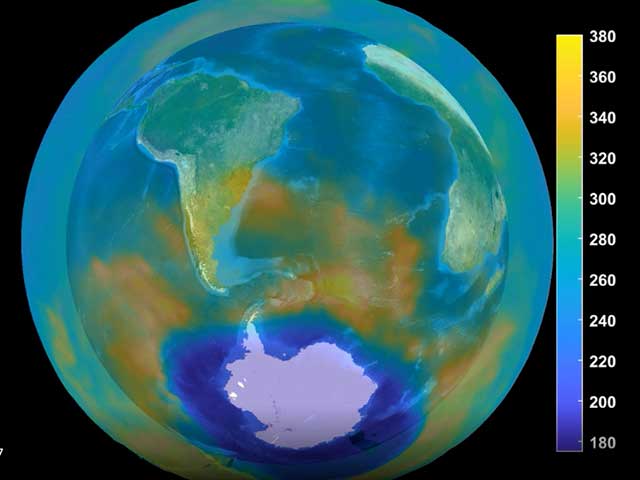
(right) Frame from Aqua Deploy Sequence animation. Image credit: Reto Stockli, NASA Earth Observatory
How does a spaceborne instrument like AIRS extract carbon dioxide fro Earth's atmosphere, and what are its data revealing?
The level of carbon dioxide in the Earth's atmosphere has been on the rise since the late 19th century. Charles David Keeling first proved this by careful measurements of samples collected from atop Mauna Loa in Hawaii and in Antarctica during 1957 and 1958. Since then, many scientists have measured the gas at many different spots on the Earth's surface. And Keeling's chart has become an iconic modern figure.
Since carbon dioxide slows the movement of heat away from the surface into space, increasing amounts of it will force the world to get warmer.
This makes carbon dioxide a "culprit gas" in global warming, says Jet Propulsion Laboratory scientist Moustafa Chahine. Chahine, who was born in Beirut, Lebanon and has been at JPL since 1960, has developed a new way to measure its concentration from space.
It makes use of a weather satellite instrument called AIRS that he started working on back in the late 1960s. Satellite instruments in use then depended on the use of historical air temperatures to make measurements of current air temperatures. Chahine, who had already worked out ways to measure air temperatures on Jupiter without knowing in advance what they might be, didn't think that was the right way to do it. He had wanted his instrument to work without any prior knowledge beyond basic chemistry.
Chahine had a few successful aircraft-based test flights of a prototype in 1975, but it took until 2002 to get AIRS into space. It now shares a satellite named Aqua with other instruments related to weather forecasting and study of the Earth's hydrologic cycle.
What AIRS does is measure the infrared light emitted by carbon dioxide molecules. Carbon dioxide in the air absorbs infrared emitted by the surface, and then re-radiates it at a slightly lower energy level (which is why it acts as a greenhouse gas). The exact frequency that gets emitted depends on temperature. So Chahine can take the infrared data AIRS sends back to Earth and use a mathematical inversion process to turn it into temperatures.
Or, rather, a computer does that. AIRS sends about three million measurements back to Earth every day, so an automated system handles the inversion process.
For AIRS' first few years in orbit, Chahine's focus was on making sure the instrument was performing its weather forecasting functions properly. Scientific instruments on Earth can be calibrated before each use, but once an instrument like AIRS gets shot off into space, proving that it still produces accurate information isn't easy. And Chahine had very high goals for AIRS. There have been controversies over whether the Earth is getting warmer due to global warming because the satellite instruments in use before AIRS were never designed for long-term, well-calibrated stability. Chahine wanted to put all that to rest, too.
So it took Chahine and his science team members at JPL and Caltech several years to finalize their meteorological data and move on to carbon dioxide. It was always obvious to them that AIRS could measure the gas. Chahine says "The information is all there in the spectra! We just had to figure out how to extract it."
It was here Chahine ran into resistance. 'We had one strong supporter at NASA, Jack Kaye, who was the director for science.' But he couldn't give them much money, just enough to fund a postdoctoral student at Caltech, Xun Jiang. That's because most AIRS funds had to come from money allocated for the Aqua mission, which was aimed at weather. Measuring carbon dioxide is really chemistry, not weather, so the panel of scientists that decides who gets money wasn't interested in funding Chahine's carbon dioxide dreams.
Chahine eventually got a little more money out of Caltech and JPL discretionary funds to create the carbon dioxide software. The AIRS team implemented the first version on January 2006.
Chahine claims two discoveries from his carbon dioxide measurements. First is that carbon dioxide concentrations turn out to vary by two to four parts per million. 'Before AIRS everyone thought carbon dioxide was well mixed above the boundary layer. We found that it is not.' It can vary by nearly a percent.
He reflects that carbon cycle models don't show this much variability in the mid-troposphere. 'They are all smooth. They allassume that carbon dioxide is well mixed, and it is not.' Since AIRS provides the first daily, global view of carbon dioxide distribution, he hopes it will eventually lead other scientists to make better models.
Around half of the carbon dioxide humans release every year stays in the atmosphere, but it's still a bit of a mystery where the other half goes. Carbon cycle models are used to help understand this problem, but they are still fairly crude. Yet the location of carbon dioxide 'sinks' matters to climate policymakers as well as to the health of ecosystems. AIRS provide the only global observations available of the global distribution of CO2 in the mid troposphere to validate the model circulation patterns.
His other big discovery was finding two large carbon dioxide sources in the Southern Hemisphere. 'We discovered that there is a large amount of carbon dioxide cycling around 40-50 S latitude, the Roaring 40s,' he comments. 'There are two huge anthropogenic sources feeding this. One of them is a coal liquefaction plant in South Africa that is the largest single source of carbon dioxide on the face of this planet. The second one is the power generation plants in eastern Australia. These two feed that belt daily. Especially when the winds are strong, they lift the carbon dioxide up into the mid-troposphere and AIRS can see it clearly.'
Global transport also leads to unexpected pollutant concentrations. Despite not being heavily industrialized, the Mediterranean basin is highly polluted. Persistent weather patterns transport pollutants, including carbon dioxide, across the Atlantic from North America and northward from Asia.
AIRS will soon be joined by other satellites making similar measurements including JPL's Orbiting Carbon Observatory, OCO. Chahine likens this to having multiple witnesses at a jury trial. Since carbon dioxide is a culprit gas, he says, 'you would like to have witnesses who look at the culprit from different angles. The AIRS data focus on the middle troposphere. Other measurements focus on the entire atmospheric column, from the surface to the top. The two are complementary. If you want to interpret what is going on near the surface, you have to take away what is happening in the middle troposphere.'
Written by Erik Conway, JPL Historian
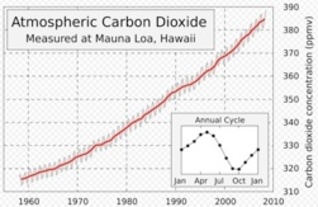 The 'Keeling Curve', showing the measured rise in the concentration of CO2 over time Credit: Wikipedia
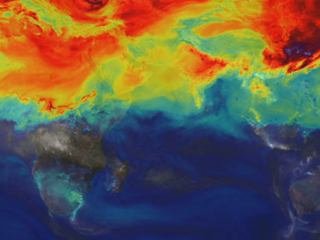
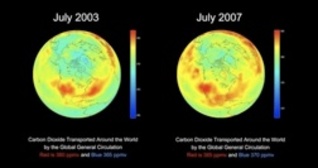 Global distribution of mid-tropospheric carbon dioxide at 8-13 km altitudes.
View larger image


