Flooding Resulting From Hurricane Isidore: Comparing data from Sept 12 and 28, 2002
Tropical Storm Isidore was born in mid-September north of Venezuela. It subsequently hit Mexico's Yucatan Peninsula as a Category 3 hurricane and came ashore near New Orleans on September 26th packing winds just below hurricane strength. Around the time of September 27, 2002, the storm was downgraded to a tropical depression as the system moved into Tennessee.
At the time the Aqua spacecraft first passed over Isidore, it was classified as a Category 3 (possibly 4) hurricane, with minimum pressure of 934 mbar, maximum sustained wind speeds of 110 knots gusting to 135 knots, and an eye diameter of 20 nautical miles. Isidore was later downgraded to a Tropical Storm and then a Tropical Depression as it lost energy.
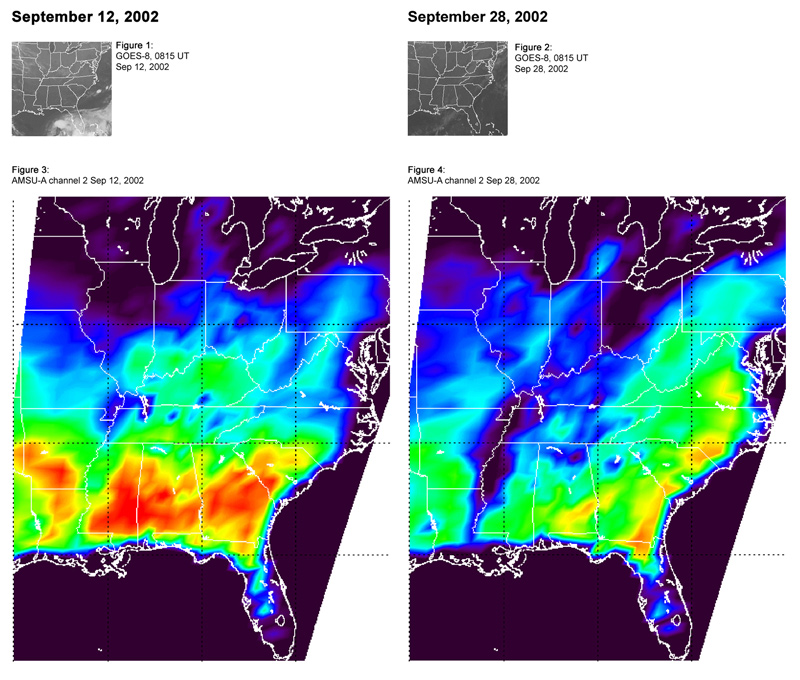
In figures 1 and 2, two images from the National Oceanic and Atmospheric Administration's Geostationary Operational Environmental Satellites show no significant weather systems over the southeastern United States on September 12 and September 28 (16 days apart). However, the microwave component of the Atmospheric Infrared Sounder Experiment on NASA's Aqua spacecraft shows a striking difference. The difference in the two microwave images (figures 3 and 4) from the AIRS Advanced Microwave Sounding Unit is primarily due to flooding after Tropical Storm Isidore. Water has a very low surface emissivity at this frequency, and that causes surface water to appear very cold (even though it is not). Land appears relatively warm (well above freezing - 273 K, even at night as seen is these images), but if there is standing water, the apparent temperature drops precipitously. Figure 4, taken just about a day after the remnants of Isidore passed over the southeast, shows heavy flooding along the Mississippi, especially in the states of Mississippi and Tennessee, but other states are also affected. The spatial resolution of the AMSU-A instrument is relatively large (each measurement spot is about 25 miles in diameter at the center of the swath), but the enormous thermal contrast in the microwave between land and water makes even small flooded areas stand out.
View a difference image made from this same data:
Flooding Resulting From Hurricane Isidore: Difference image, Sept 12 and 28, 2002
