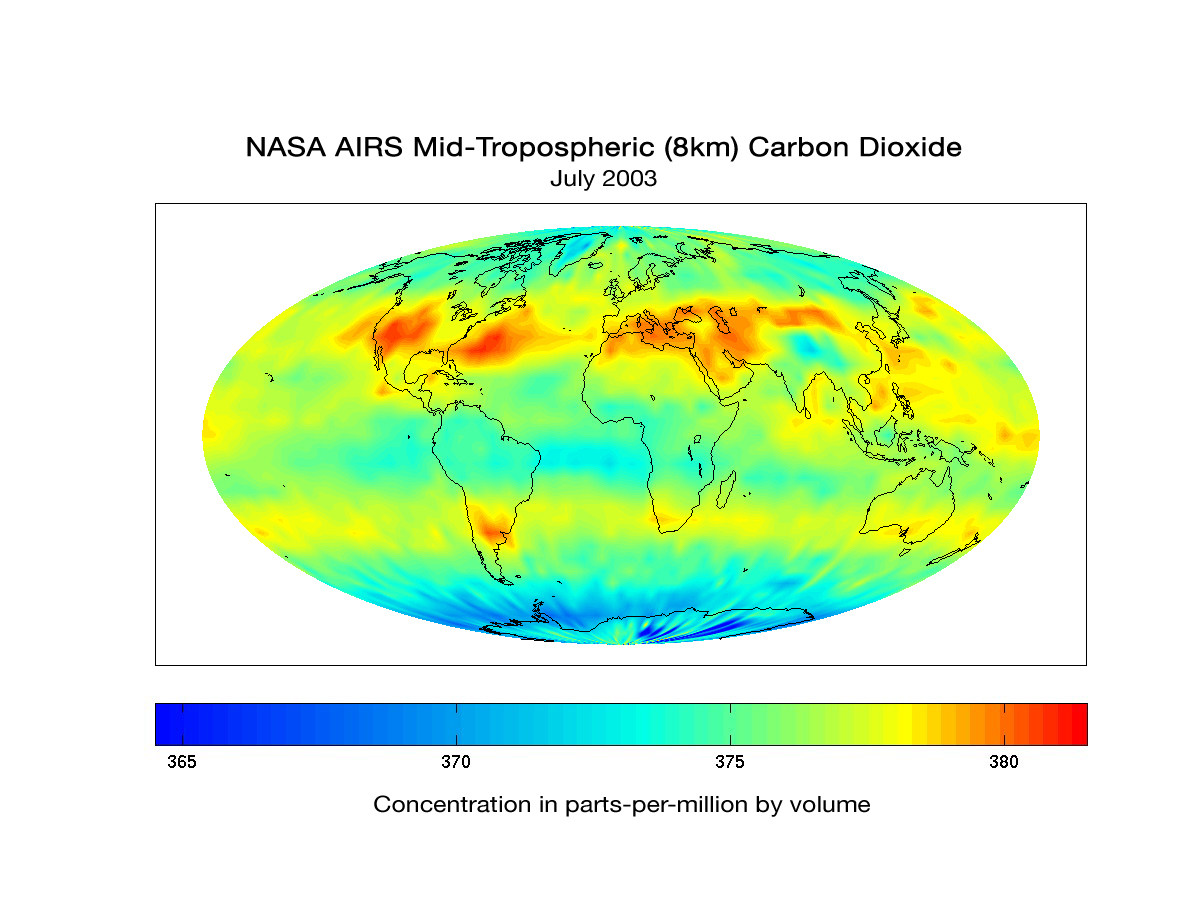
Global Map of Carbon Dioxide 2003
Although originally designed to measure atmospheric water vapor and temperature profiles for weather forecasting, data from the Atmospheric Infrared Sounder (AIRS) instrument on NASA's Aqua spacecraft are now also being used by scientists to observe atmospheric carbon dioxide. Scientists from NASA; the National Oceanic and Atmospheric Administration; the European Center for Medium-Range Weather Forecasts; the University of Maryland, Baltimore County; Princeton University, Princeton, New Jersey; and the California Institute of Technology (Caltech), Pasadena, Calif., are using several different methods to measure the concentration of carbon dioxide in the mid-troposphere (about eight kilometers, or five miles, above the surface).
The global map of mid-troposphere carbon dioxide above, produced by AIRS Team Leader Dr. Moustafa Chahine at JPL, shows that despite the high degree of mixing that occurs with carbon dioxide, the regional patterns of atmospheric sources and sinks are still apparent in mid-troposphere carbon dioxide concentrations. "This pattern of high carbon dioxide in the Northern Hemisphere (North America, Atlantic Ocean, and Central Asia) is consistent with model predictions," said Chahine.
Climate modelers, such as Dr. Qinbin Li at JPL, and Dr. Yuk Yung at Caltech, are currently using the AIRS data to study the global distribution and transport of carbon dioxide and to improve their models.
