News | June 4, 2013
The increase in carbon dioxide in Earth's mid-troposphere from 2002 to 2013

Sharon Ray, Jet Propulsion Laboratory
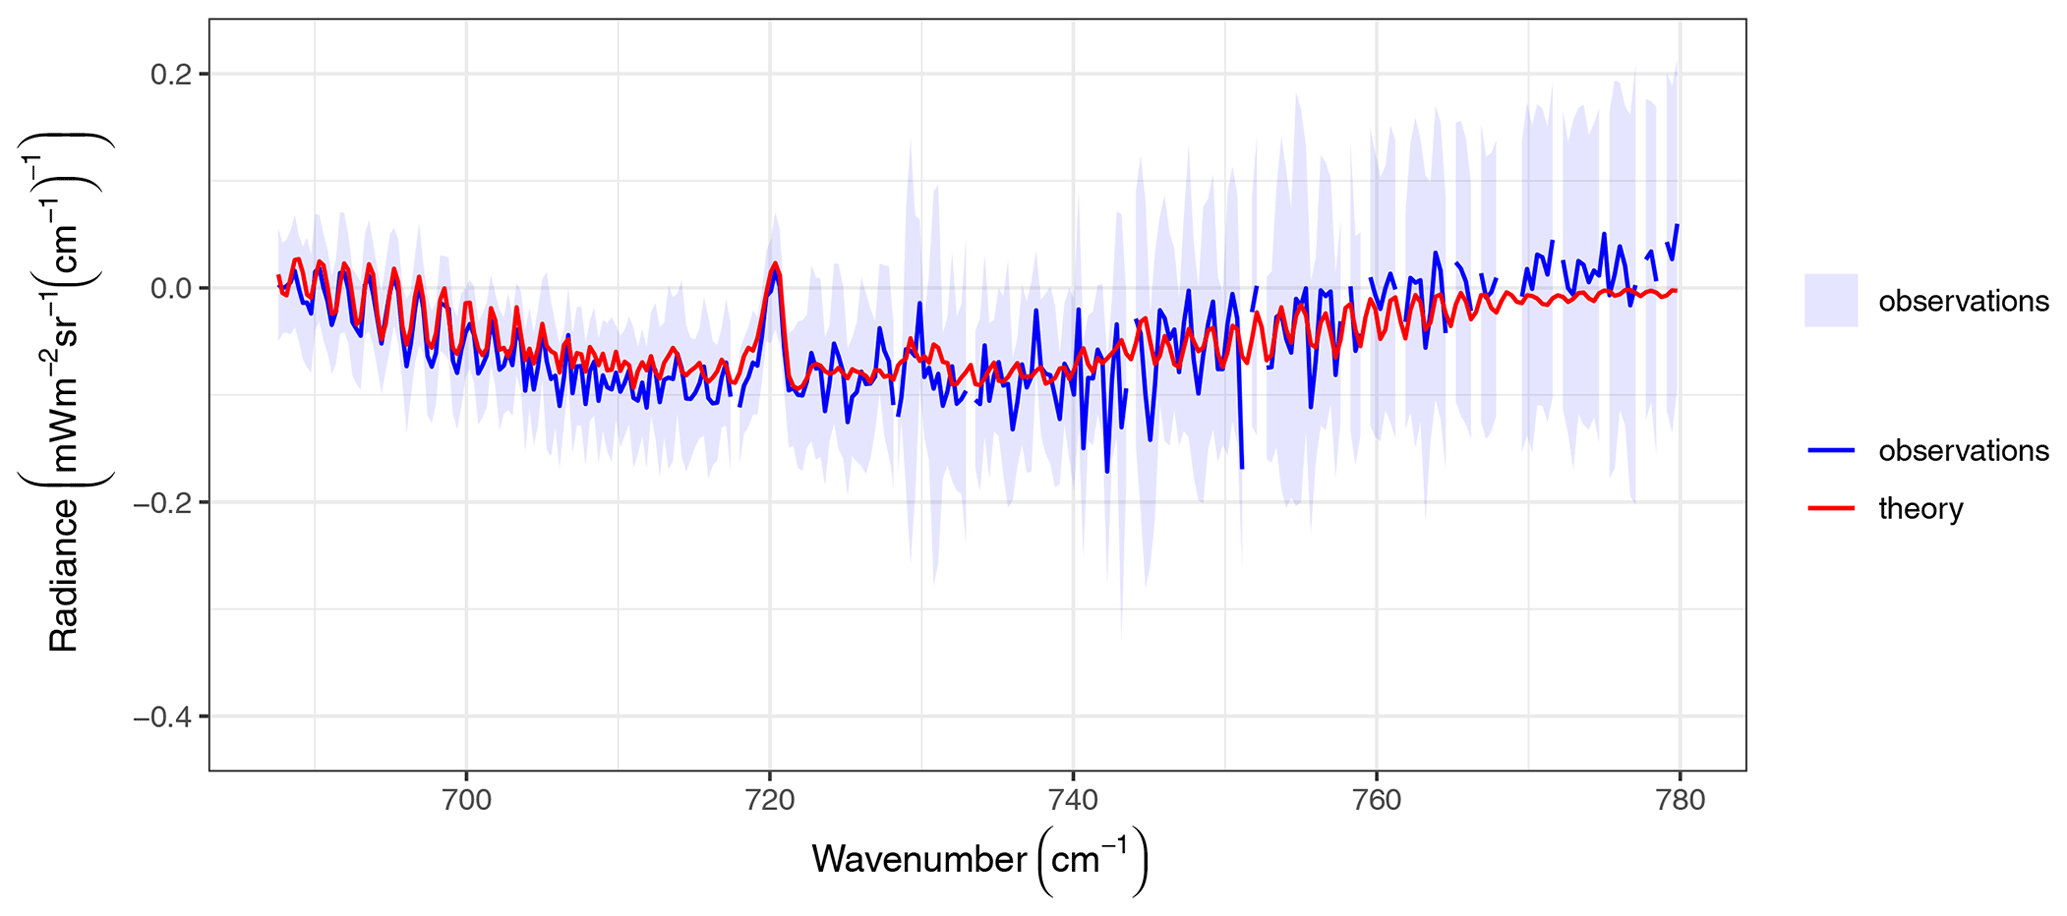
On May 4, 2002, a Delta-2 rocket carrying NASA's Aqua satellite was launched into space from Vandenberg Air Force Base near Lompoc, California. Aboard the satellite was an instrument designed to deliver weather and climate information of Earth's atmosphere using a technique called infrared sounding. Now in orbit the Atmospheric Infrared Sounder instrument, or AIRS for short, measures the infrared, or heat, energy emitted by Earth's surface and atmosphere. From this measurement the concentration of many of our planet's trace gases, including the greenhouse gas carbon dioxide, are extracted.
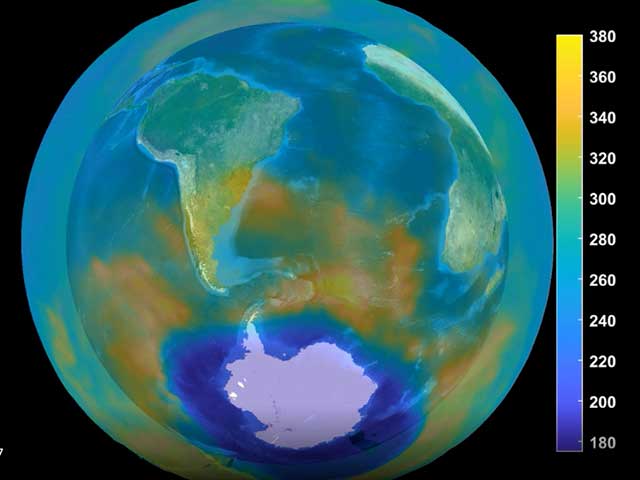
The troposphere is the lowest seven to ten mile high layer of atmosphere that begins at Earth's surface, and the AIRS instrument detects carbon dioxide best in middle of it at altitudes between 15,000 and 30,000 feet. In 2002, AIRS--which collects data around the entire globe every day--reported the average concentration of carbon dioxide in Earth's mid-troposphere to be 372 parts per million (ppm). Still going strong in 2013, AIRS reported April's average daily global concentration in this region to be 397 ppm, with peaks exceeding 400 ppm. The concentration of carbon dioxide in the mid-troposphere lags behind the concentration found at the surface due to the time it takes the gas to be transported to this height. But when compared against the historic record which began in 1958 at Hawaii's Mauna Loa Observatory, the measurements made using AIRS data tell the same tale: atmospheric carbon dioxide is consistently increasing by about 2 parts per million, year after year, over the entire Earth.
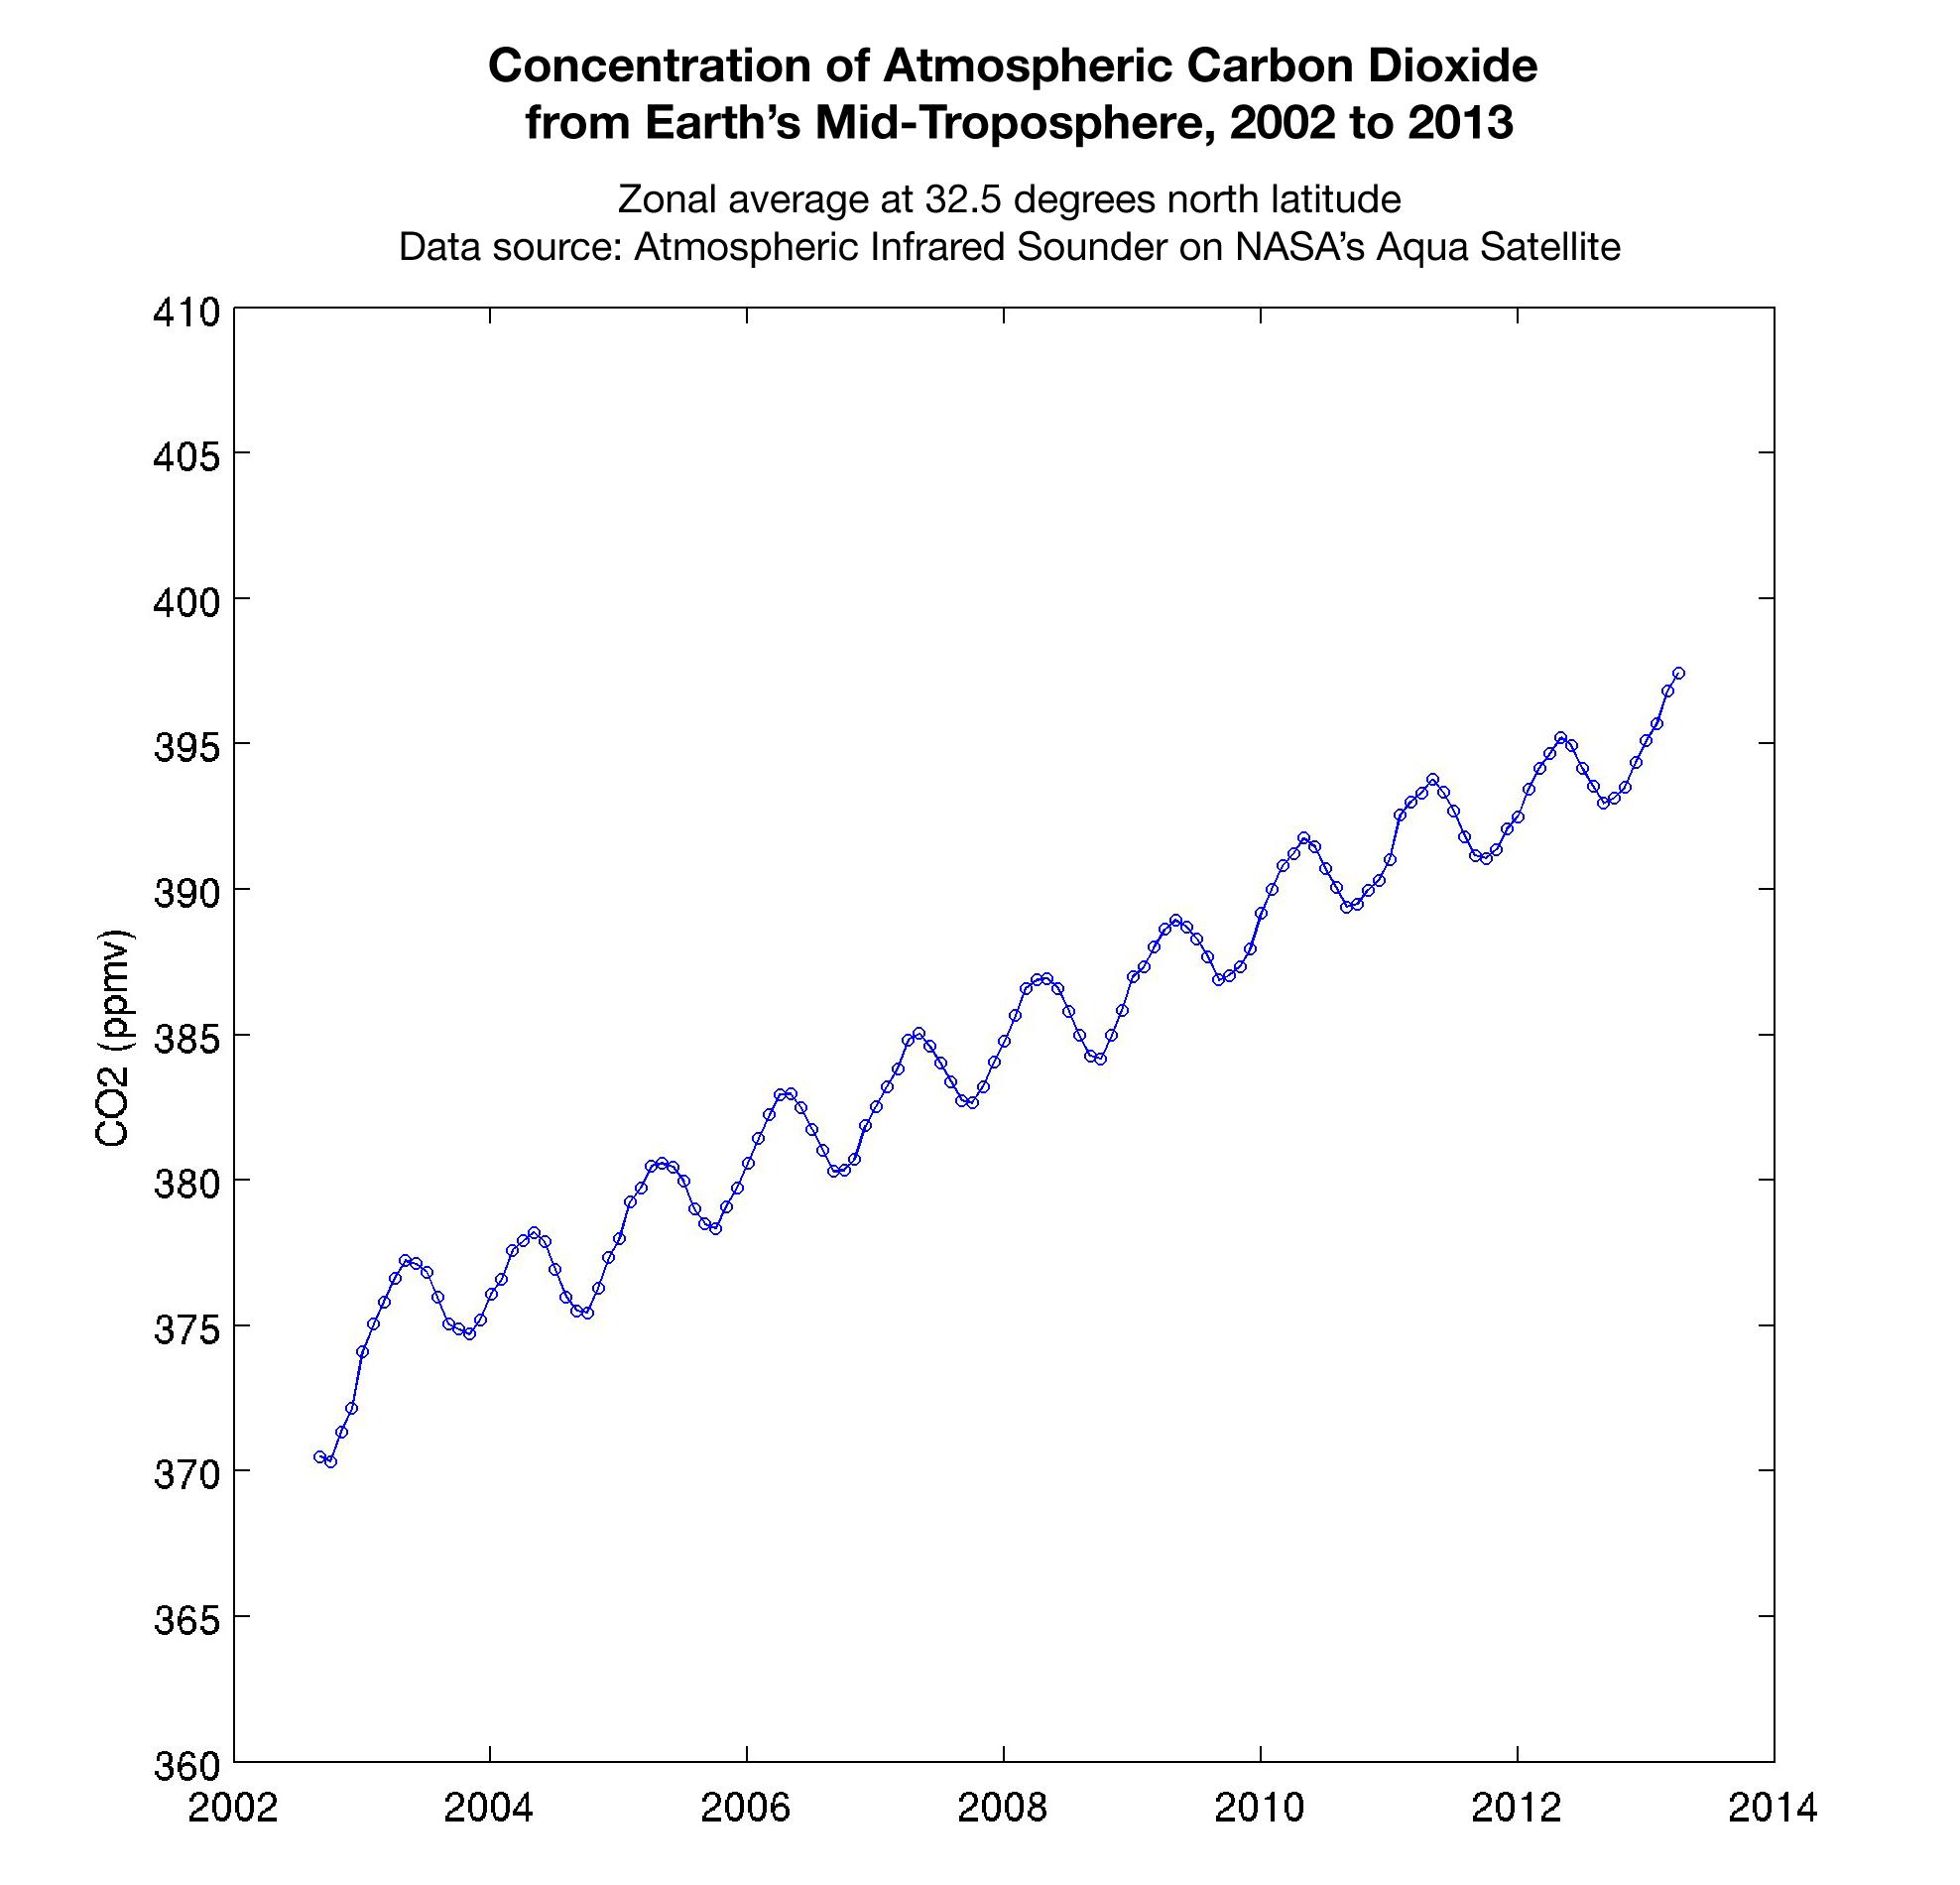
This graph made with data from the Atmospheric Infrared Sounder on NASA's Aqua satellite shows the concentration of carbon dioxide in Earth's mid-troposphere, located roughly between three to six miles (five to nine kilometers) in altitude.
The saw tooth pattern reflects plants "breathing in" carbon dioxide as they grow, removing this gas from the atmosphere. Soil and plants then release carbon dioxide back into the atmosphere when plants die at the end of the growing season. The upward slope of the graph shows the continuous increase in the concentration of carbon dioxide in Earth's atmosphere.
The concentration of carbon dioxide in the mid-troposphere lags the concentration found at the surface as mixing from the lower to upper altitudes usually takes days to weeks. In addition, changes in concentration of carbon dioxide at Earth's surface are not always carried up to higher altitudes.
While AIRS is able to detect carbon dioxide in Earth's atmosphere to an accuracy of 4 parts per million (ppm), the precision of the measurement clearly corroborates the roughly 2 ppm annual increase in the concentration of this greenhouse gas.
Image credit: NASA/JPL-Caltech
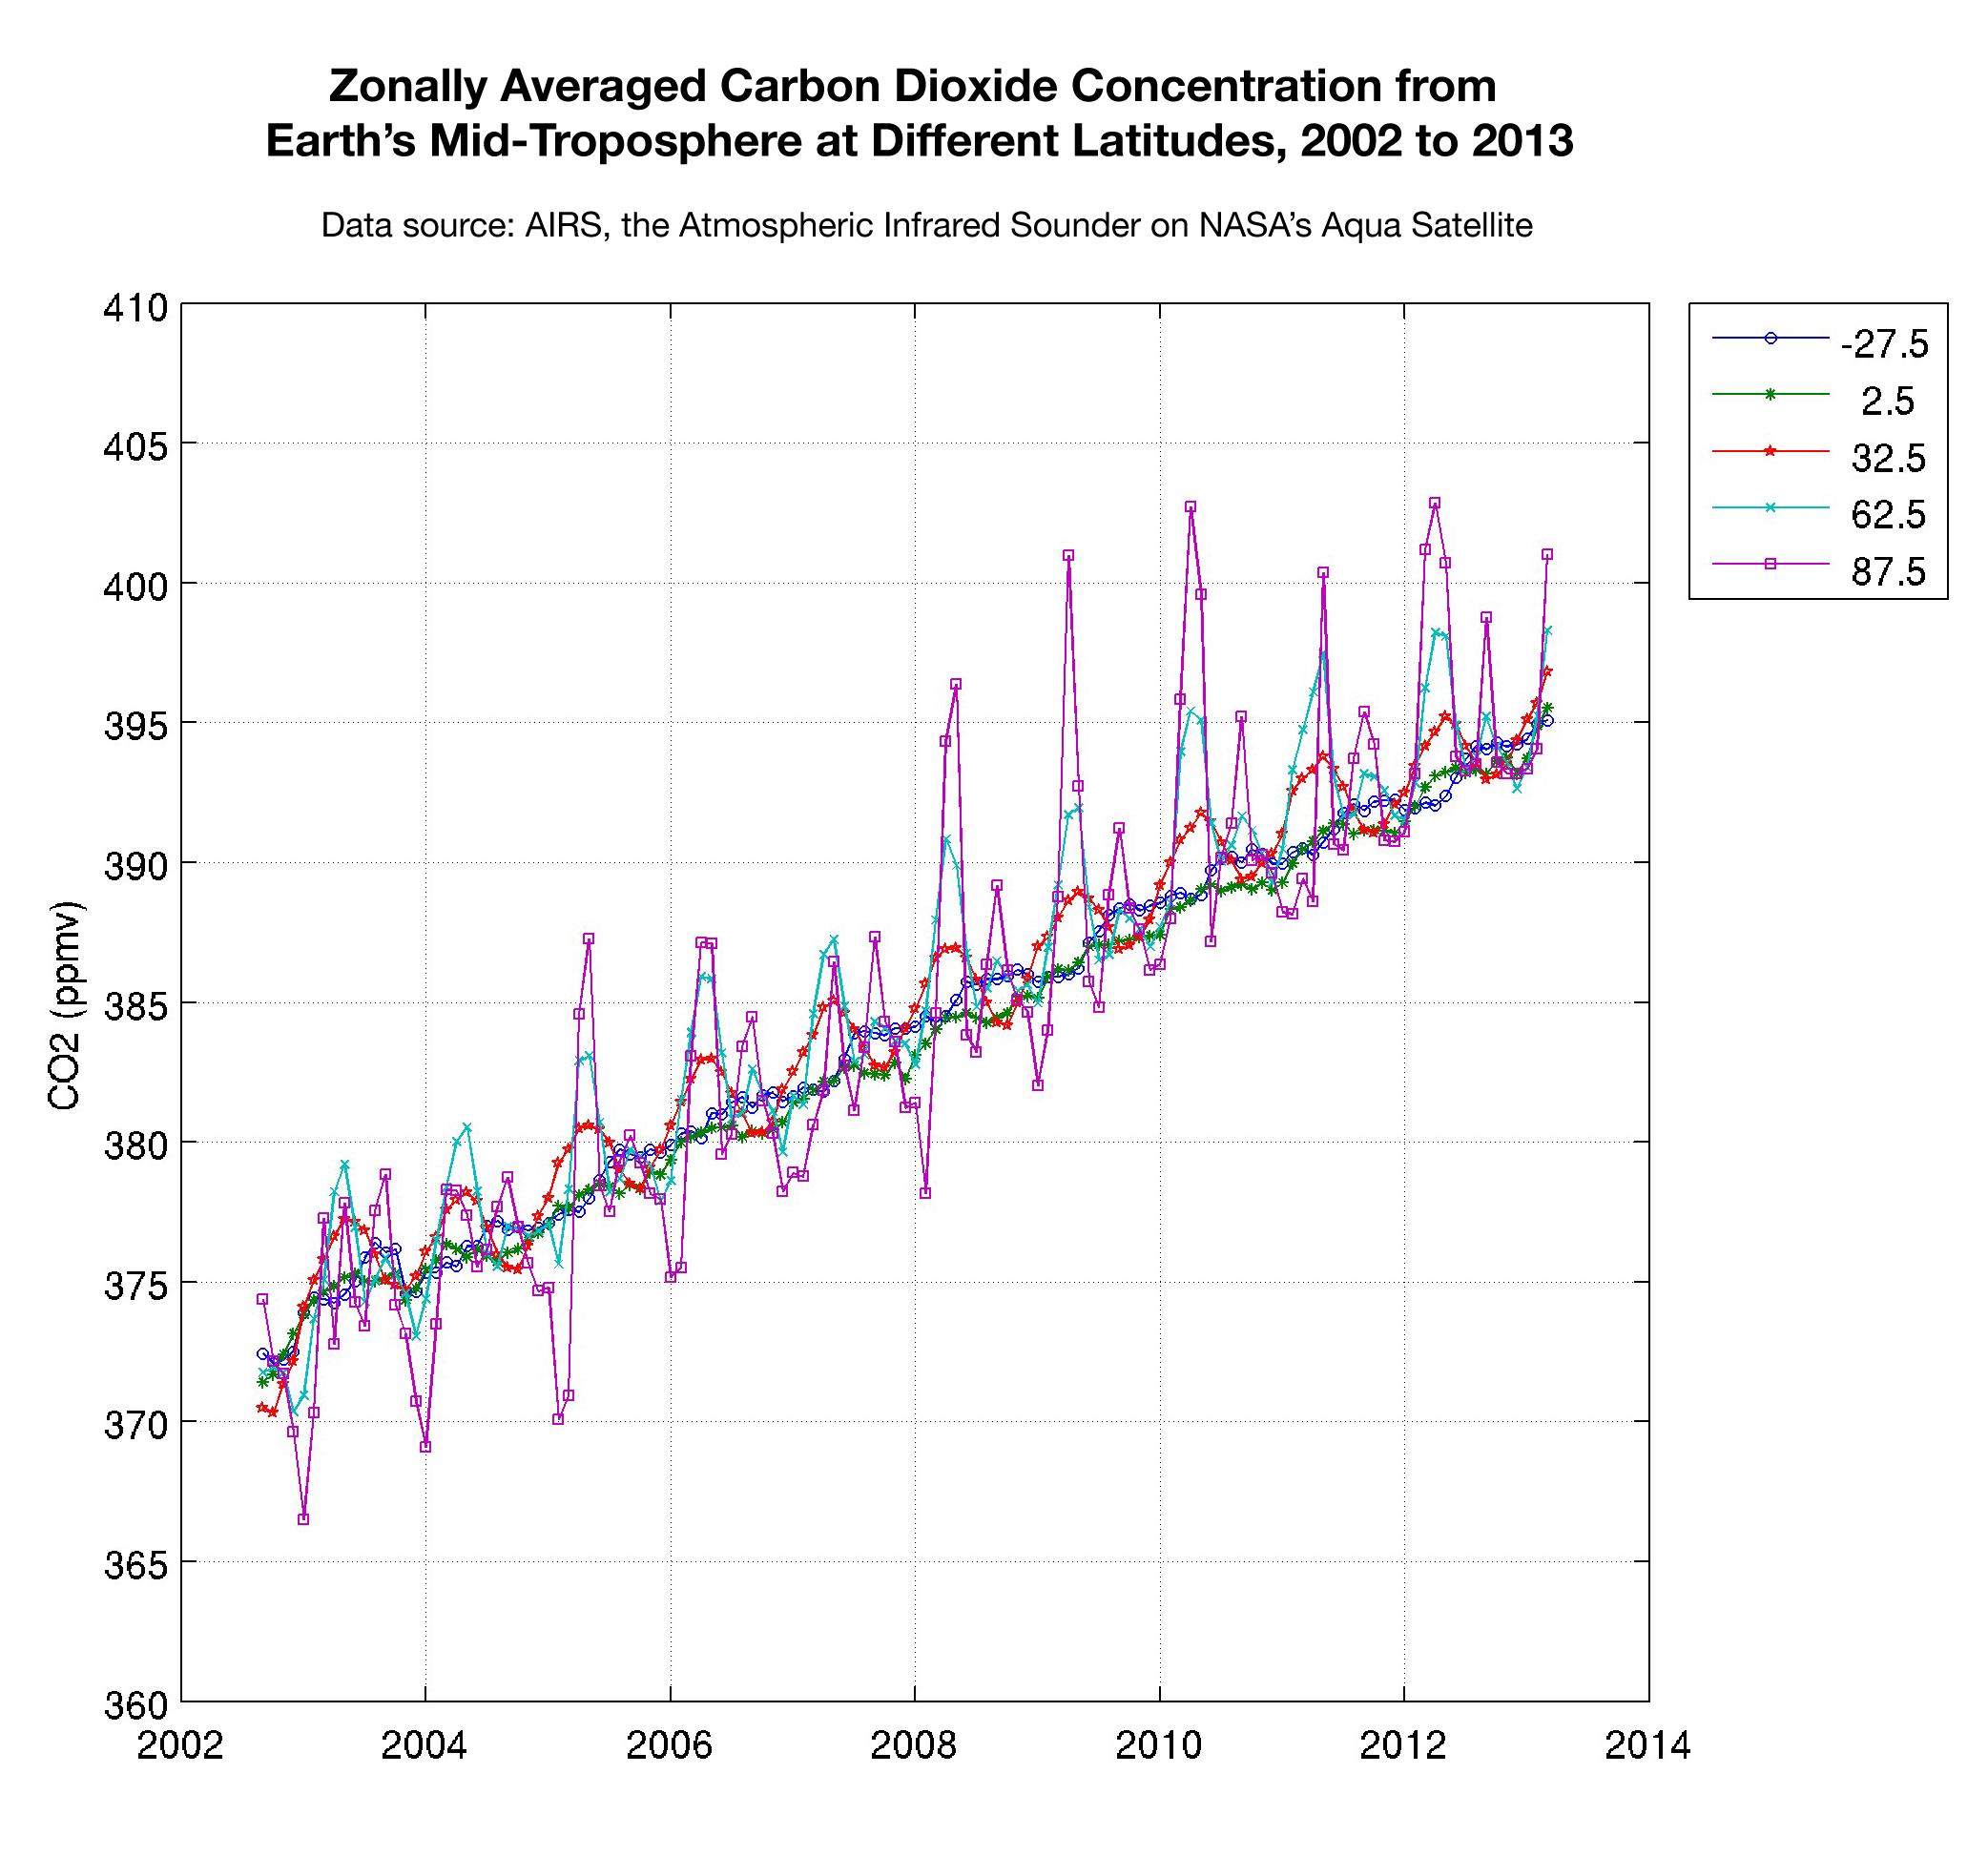
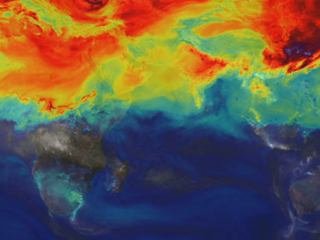
This plot shows the concentration of carbon dioxide in Earth's mid-troposphere at various latitudes as measured by the Atmospheric Infrared Sounder (AIRS) instrument on NASA's Aqua satellite. The colored lines represent different latitude bands that circle Earth, called "zones". The central latitude for each zone is given in the legend.
In the zone nearest the equator, represented by the green line, the swing in the amount of carbon dioxide is minimal since plants in the tropics remain green all year long. The seasonal intake of carbon dioxide by plants as they grow and then released when they die is not pronounced here.
In the middle latitudes at 32.5, 62.5, and -27.5, we see greater swings in carbon dioxide due to the seasonal growth and die-off of plants in these regions.
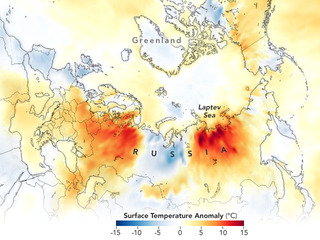
Near the north pole, around 87.5 degrees latitude, we see the greatest amplitude in the seasonal cycle of carbon dioxide. But in this region the concentration of carbon dioxide is mostly driven by atmospheric circulation patterns which transport the gas from more southern latitudes into the Arctic as polar winds weaken in the spring. It is in this region where the concentration of carbon dioxide reaches its highest peak on Earth.
AIRS is still in the process of validating its global carbon dioxide concentration levels, but the early results show excellent agreement with field measurements and model predictions.
Image credit: NASA/JPL-Caltech
Reviewers: Tom Pagano, AIRS Project Manager; Joao Teixeira, AIRS Science Team Leader; Eric Fetzer, AIRS Project Scientist; Ed Olsen, AIRS Carbon Dioxide Lead; Jet Propulsion Laboratory